lundi, mai 29, 2006

Technical Weekly 29052006

EQUITIES
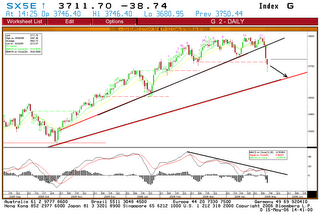
Last week I said that : “the Euro-Stoxx 50 has reached its 200-day moving average and potential chart support and that may be enough to cause a market rebound this week.”
The rebound is happening now but the market won’t just bounce off a “V” bottom and return to the bullish way because from a longer- term view, major technical and emotional (psychological) damage has been done.
For the last six months, any modest decline resulting in a slight oversold condition was fuel for the 'buy the dip' crowd to take prices strongly higher again. That is no longer the case.

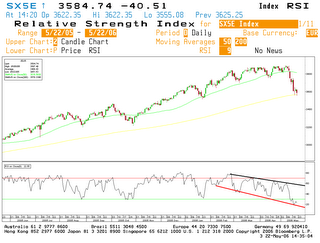
The graph below shows the Euro Stoxx 50 rebounding on the 200 moving average with low volume, which is generally not a good sign.


COMMODITIES
Brent

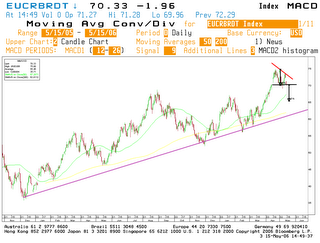
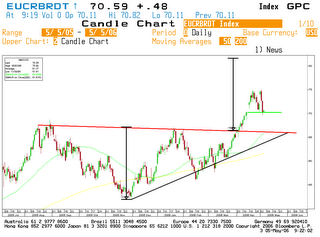
The long-term uptrend for the Brent is still intact and the short- term consolidation favours further strength because the Macd indicator (see graph below) is now close to gives a short term buy signal.


Gold
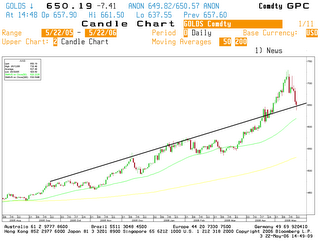
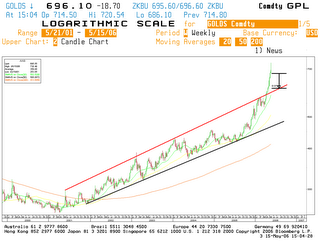
Further consolidation around 650$ is expected.

A break below that level could imply a deeper correction to the 600$ level.


GERMAN 10 YEAR YIELD
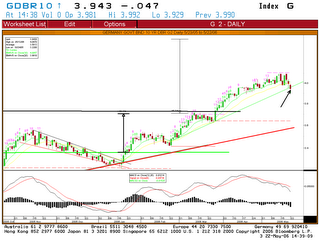
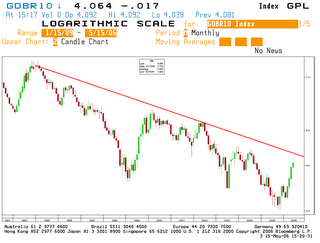
The short-term recovery continued for bonds and a retest of the 3.77% level seems likely.(see arrow on chart)

However on a long-term basis the downtrend still trend prevails for bonds.


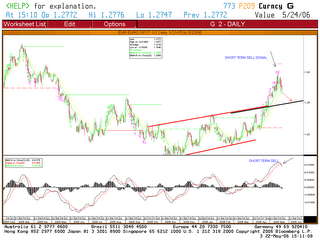
EURO-DOLLAR
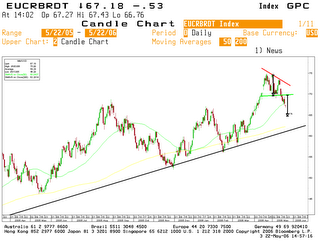
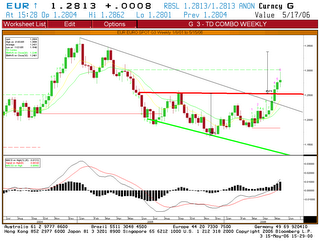
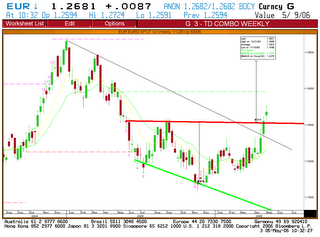
As long as support at 1.2520 holds, the outlook would remain higher towards a test of 1.30.

A move back below 1.2520 would negate this bullish view, and suggest a test of the long term support line which currently lies at 1.2100.

lundi, mai 22, 2006

Technical Weekly 22052006

EQUITIES
After the “sell off” of last week, equities markets are now oversold.
However, the longer-range chart picture has weakened, with most weekly indicators on sell signals.
The daily chart below shows the Euro-Stoxx 50 and the 9-day RSI line below 30 for the first time this year.
In addition, the index has reached its 200-day moving average and potential chart support. (in yellow)
That may be enough to cause a market rebound this week.
However, while short-term indicators are oversold, weekly and monthly indicators are not.

Since weekly and monthly indicators are more important than daily ones, technically speaking I would continue to view any short-term rally as another selling opportunity.


COMMODITIES
Brent
Validates a short-term bearish pattern reversal pattern last week.

The next key support is located around 63$.


Gold
The trend of gold is in a short-term decline (matching the bonds recovery).

Because the selling pressure is not over yet, I advice not to buy before a successful test of the rising channel.


GERMAN 10 YEAR YIELD
The short-term technical picture changed to neutral.
The short-term Macd indicator is falling and should support the slowly improving short-term outlook for bonds.
A break of the rising trend-line (see arrow on the chart below) is needed to change my view and to be short term bullish.

However on a long-term basis the downtrend still trend prevails for bonds.


EURO-DOLLAR
The short-term fight to quality could well force the US dollar higher even against the EURO, but the long-term trends remain bearish for the $.
The daily chart below shows the rate in correction mode with a probable retest of the 1.25 level in the coming weeks.

mardi, mai 16, 2006

ROTATION SECTORIELLE

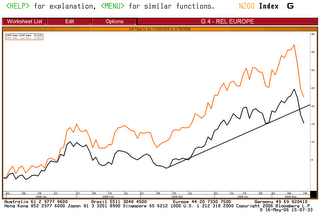
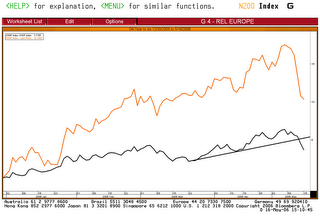
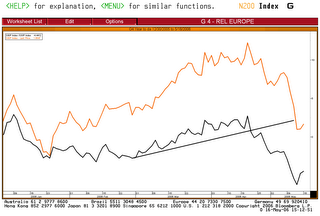
De nombreux facteurs plaident pour un mouvement de rotation sectorielle des valeurs cycliques vers les valeurs défensives.
A savoir : pause, voir baisse sur le marché des actions, pic sur certains indicateurs économiques avancés, hausse de l'euro, pic du momentum de révision des bénéfices des sociétés et le plus important des changements sur les graphiques.
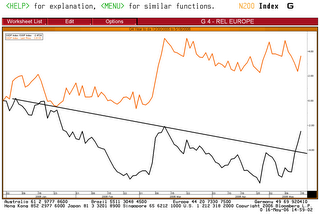
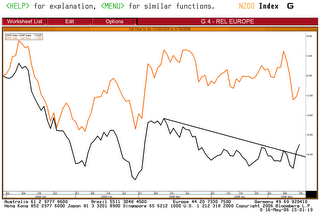
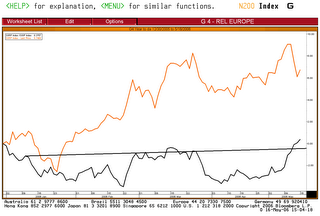
En voici quelques uns, avec en rouge le graphique absolu et en noir le graphique relatif par rapport au DJ STOXX 600.
SECTEURS DEFENSIFS :
DJS HEALTH CARE


DJS TELECOM


DJS RETAIL


SECTEURS CYCLIQUES:
DJS BASIC RESOURCES


DJS INDUSTRIALS


DJS TECHNOLOGY

lundi, mai 15, 2006

Technical Weekly 15052006

EQUITIES
The technical short-term outlook is now bearish.
In the US for instance, there has been no 9% correction for 1,181 days, we are in the second years of the 4-year Presidential cycle and most of the technical indicators I follow gave recently sell signals on a weekly and daily basis.
However I would be excessively bearish on the major indices unless some of the major support areas are broken: 1285 for the SPX 500 and 3600 for the Euro Stoxx 50.(see graph. below)If those supports hold in the coming weeks, I expect this market to trade in a range.


COMMODITIES
Brent
The small bearish pattern could still be activated if the brent closes below the 70$ level.
If this event happens, this will be probably not the beginning of a significant bearish reversal but just a minor pullback.

Only a breakdown below 63$ would modify my view.


Gold
Last week, I wrote that the trend of gold was turning parabolic and that a correction was coming.

This is now happening and I advice not to buy before a successful test of rising channel.(still 10% correction possible!)


GERMAN 10 YEAR YIELD
In the US, the benchmark 10-year Treasury note finished the week down with a yield hitting another four-year high of 5.189 percent.
I still think that a correction may start soon before yields rise again.

The monthly graphic below shows the German government bonds 10 year yield in a rising trend since October 2005 challenging an important downtrend line around 4.3%.


EURO-DOLLAR
After the recent strong performance the rate is now overbought and a pause is expected in the coming days.

I don’t forecast a major bearish reversal and on the contrary the rate could reach the 1.3 levels in the coming weeks.

lundi, mai 08, 2006

Technical Weekly 08052006

EQUITIES
As expected, equity markets rebound from oversold conditions.
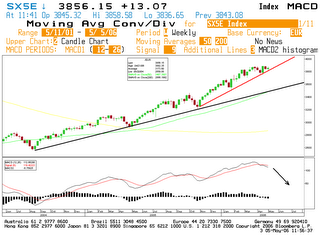
The long- term bull trend is intact but the sharp rise of the Euro-dollar and the persistent rising yields could push pressure on equities in the coming weeks.The chart below of the DJ Euro Stoxx 50 is already showing some sign of weakness as the weekly Macd indicator turns recently bearish.


COMMODITIES
Brent
My target remains in the 84-85$ zone in the coming weeks and I do not believe that the recent decline last week is the start of major correction.

However, on a short term basis a small bearish double top may be forming.


Gold
The uptrend of gold is now turning parabolic.
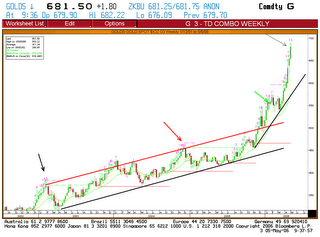
This advance will be hard to sustain and I believe that a correction is coming soon.Each time the Td combo indicator gave a sell signal (see arrows on the weekly chart) the price of gold strongly moved back.


GERMAN 10 YEAR YIELD
Yields are now overbought and may start a short-term correction soon.
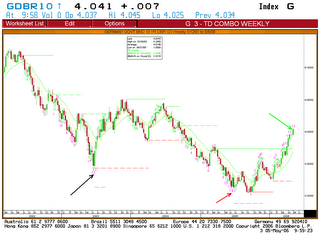
The TD combo indicator sell signal on the weekly chart reinforces this probability (see arrows).However my technical target in the coming weeks remains 4.5%.


EURO-DOLLAR
Easily exceeded my short-term target and accelerated sharply last week.The rate could reach the strong 1.3 resistance zone in the coming weeks and the target of the right angle broadening bottom pattern (historically 89% of successful formations) is 1.34.