jeudi, août 28, 2008

Saisonnalité

La fin de l'été approche déjà et l'activité du marché est susceptible de reprendre durant les prochaines semaines.
Si l'histoire se répète, les quatre derniers mois devraient apporter une certaine amélioration pour le marché actions.
L'histoire montre cependant, que le mois de Septembre pourrait encore présenter un risque avant que le marché ne se reprenne plus durablement.Sur le graphique ci-dessous, nous analysons la tendance historique moyenne du SP 500 pendant les quatre derniers mois de l'année.
La ligne bleue montre la tendance du SP500 de 1960 - 2007, alors que la ligne rouge montre la moyenne des dix dernières années.
Vous pouvez observer que le SP 500 diminue encore pendant la majeure partie de septembre avant de se reprendre et de présenter une tendance haussière début Octobre jusqu'à la fin de l’année.


Je surveille plus particulièrement certains indicateurs économiques avancés qui ont une corrélation très forte avec le marché actions.
Le deuxième graphique compare la confiance des consommateurs aux USA avec le Dow Jones. Nous observons 2 choses très importantes.
Premièrement la Confiance des Consommateurs se situe à des niveaux extrèmement bas et deuxièmement le dernier chiffre (publié récemment) est en augmentation.
Historiquement si dans les prochains mois cet indicateur parvient à remonter et à franchir la barre des 66, l’indice progresse en moyenne de 23.1% sur 1 an !


"click on the chart to enlarge"

jeudi, août 14, 2008

Stoxx 600 vs SP 500

This relative chart compares the Stoxx 600 vs the SP 500 in €.
May be time to go US.

"click on the chart to enlarge"

$

If history is guide, according to this chart based on the 4 year presidential cycle, the US dollar should rise in the coming months.


"click on the chart to enlarge"

mercredi, août 13, 2008

Commodities

The top formation in the DJ STOXX 600 BASIC RESOURCES index confirms a reversal of the uptrend from the 2002 lows.
The downside risk in the coming weeks according to this bearish head and shoulder pattern is minimun 15%.
As you can see most of the index members are technically weak (most momentum indicators are on sell signals-table 1 and 2)
Large speculators are selling commodities suggesting hedge funds are deleveraging commodities


On a short term basis the sector is oversold (short term target reached and short term buy signal-green arrow on chart) meaning a rebound is occuring.

Stocks - Stuck In A Long-Term Sideways Pattern?


"click on table to enlarge"

mardi, août 12, 2008

Oil and he stock market

Since 2002, there seems to be a strong correlation between the stock market (SP 500-black line) and Oil (WTI-red line).
In fact the stock market leads WTI by 1 year.
If history is guide the chart below implies a relief rally for oil before going back to 100$.


"click on the table to enlarge"

lundi, août 11, 2008

Bear market rally

The DJ Euro Stoxx 50 seems to be able to surpass the 3400 resistance zone.
As you can see momentum is still up and the buy signal validated by the TD sequential in July is still valid.(green arrow)
It seems to be too early to take profits on this bear market rally, as according to history,the average bear market rally last 2 months and delivers +/- 20% performance.


"click on the table to enlarge"

vendredi, août 08, 2008

€/$

The €/$ fall below its 200 day moving average (green line) for the first time since March 2006.
As you can see this breakdown was preceeded by a huge negative divergence on the Macd.
The first support zone is 1.488 and the minimun target of this bearish distribution pattern is 1.468.

mercredi, août 06, 2008

Baltic dry index and bonds yield

The Baltic Dry Index has now declined for 17 straight days and hasn't had an up day since early July.
Since its peak in the Spring, the index is now down more than 30%.
Given that the index measures tanker shipping rates, falling prices are considered a sign of global economic weakness.
As you can see the Baltic Dry Index (red line) is highly correlated with Bonds yield.(German 10 yr-black line) and suggests more upside for bonds(at least in the short term).

mardi, août 05, 2008

IFTA 2008

The 21st annual International Federation of Technical Analysts (IFTA) conference will be held from 6-8 November 2008 at le Meridien Etoile Hotel, Paris, France.
More informations here :http://www.iftaparis2008.com/

Commodities indices Part2

Big distribution top pattern on the DJAIG Agriculture index but support around the 75$ level.


The DJ Industrial Metals is testing critical support, a break below this level
could open the door to a retest of the long term uptrend.

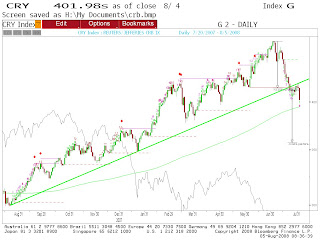
CRB Commodity Index Caps Biggest One-Day Decline Since March

http://www.bloomberg.com/apps/news?pid=newsarchive&sid=aN8czV3PcwUI


Interesting report coming from Bloomberg.
Most commodities indices broken up their uptrend.
The CRB index trades now close to the 200 day moving averages (green line)
but the target of this bearish breakdown is now 10% lower around the 350-360 level.


vendredi, août 01, 2008

German Gov bonds yield

As you can see on the first chart, the Bund in yield is caught in a long term bull trend channel but on the second chart (which is a zoom of the first one) a double top pattern is developping meaning we may first go to the 4% level before we go higher later.

Tading range expected

The chart below compares the 1968-1969 period(red line) to the 2007-2008 period (blue line) for the SP500.
If history is guide, the SP 500 could trade sideways during the coming months.


"click on the chart to enlarge"