EQUITIES
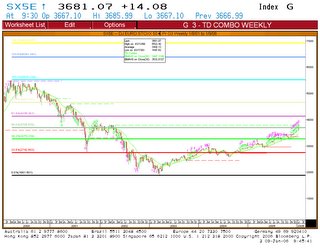
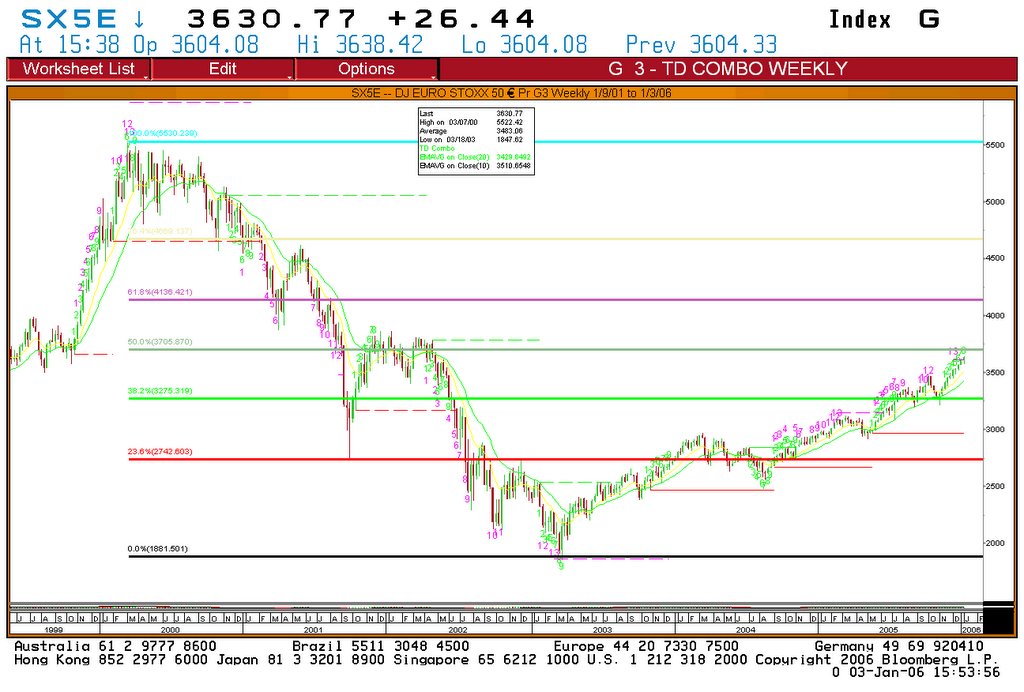
The market rallied strongly on the back of the release of the December FOMC minutes.
As a result, the Euro Stoxx 50 is approaching the 3700 resistance zone and is now overbought.
The bulls expect that the trend should remain positive and the bears figure that the bulls have spent all their "new year's" money and are about out of cash.Ibelieve that the overall trend should remain positive, short terms pullbacks are likely but the index could challenge the next target zone around 3800.
COMMODITIES
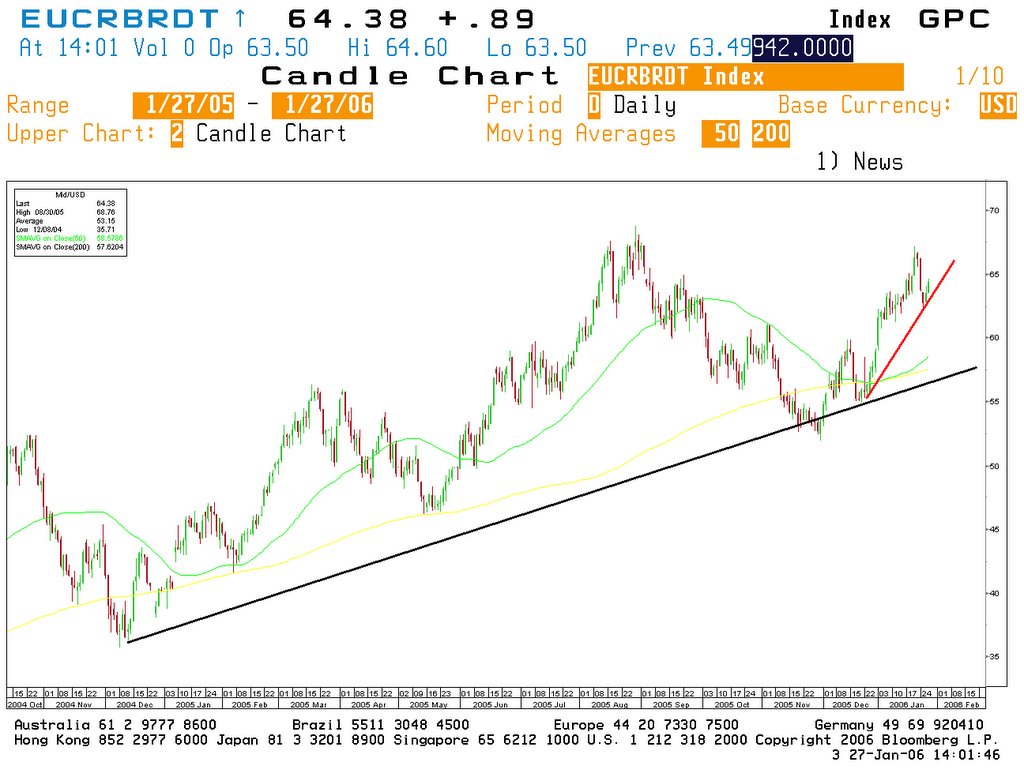
Brent
Take a look at this long-term chart of oil.
It is clearly in a secular uptrend. However during the US hurricane season oil ran ahead too quickly, culminating in September's medium-term peak as Katrina struck. The chart also shows that oil's reaction bottomed in November and that the price is now on its way back up.

>
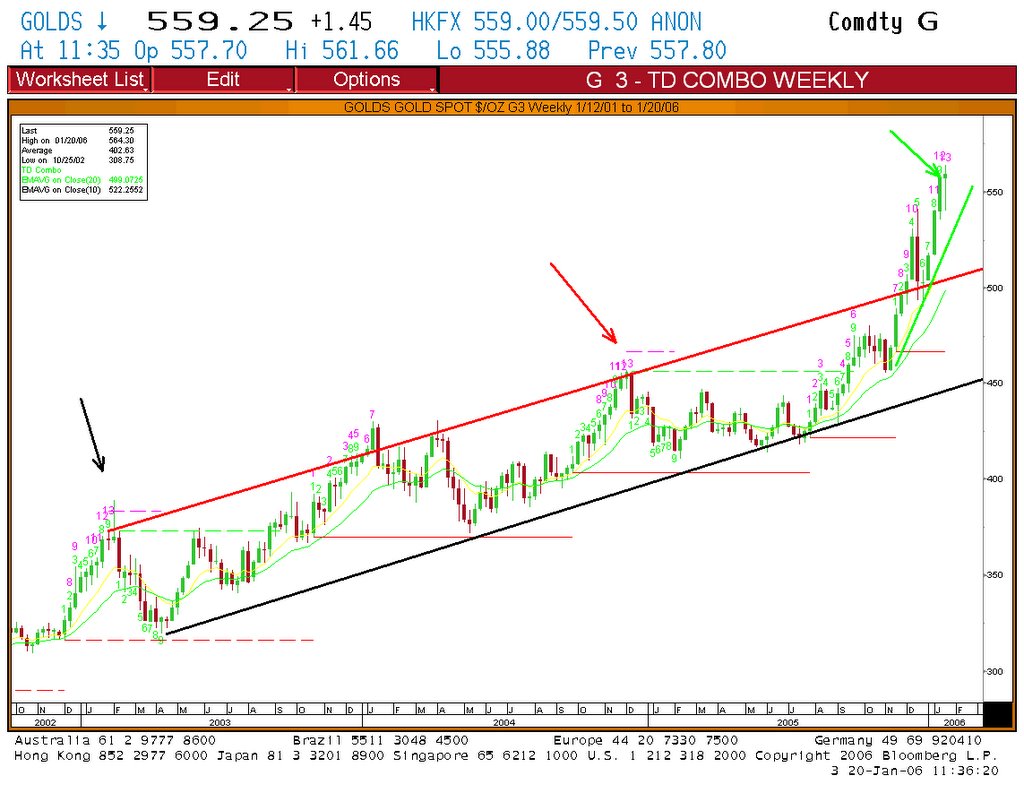
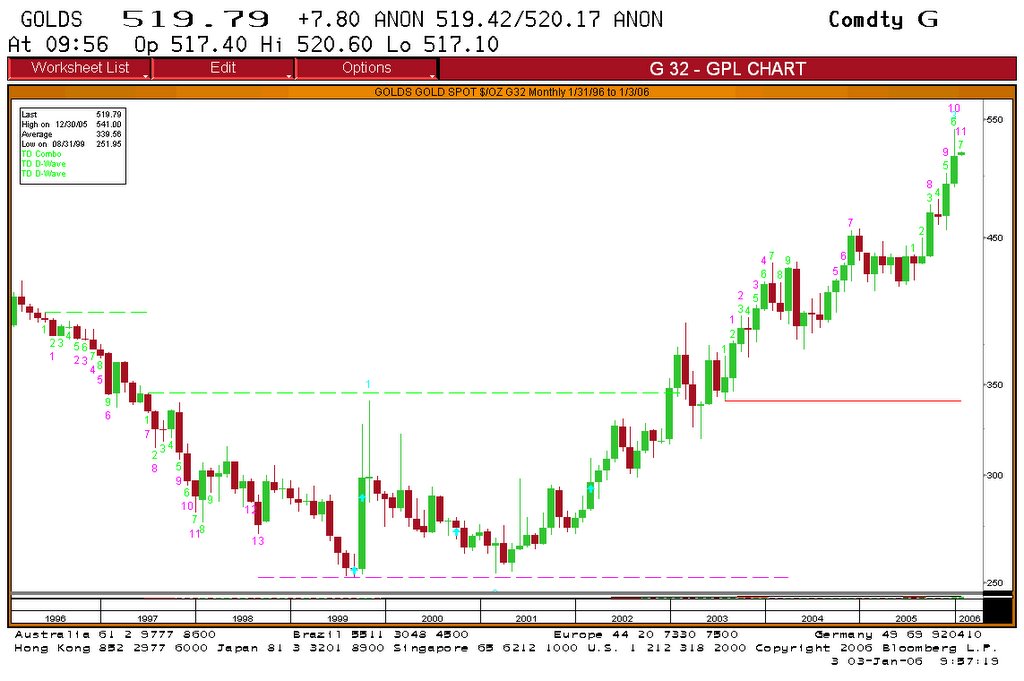
Gold
After a brief pause and a pullback to the upper trend-line of the rising channel, the bullish trend accelerates sharply.
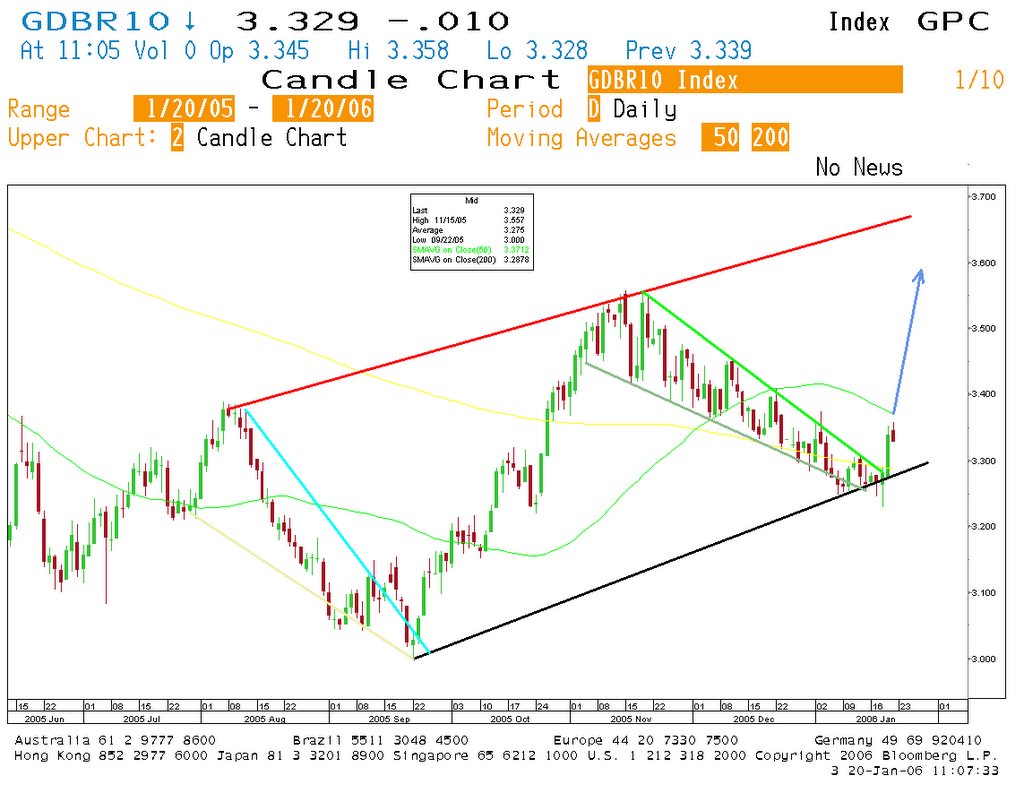
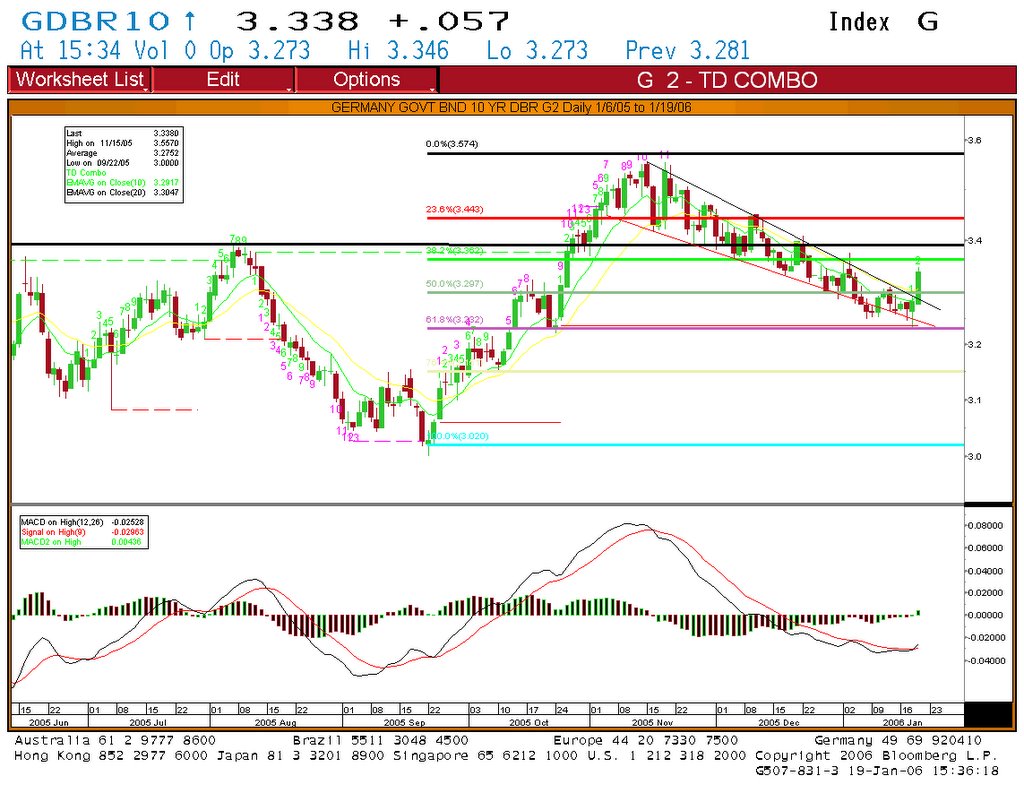
GERMAN 10 YEAR YIELD
European 10-year government bonds rose for a fourth week as signs of inflation in the euro region is slowing damped hopes over how far the European Central Bank will raise the benchmark interest rate this year. Ten-year debt rallied, pushing yields to their lowest in 2 1/2 months, after a report Jan. 4 showed inflation in the 12- nation economy slowed to 2.2 percent in November, nearing the ECB's target.The graph. below shows the German Government Bond Yield approaching support at the 3.23% level.

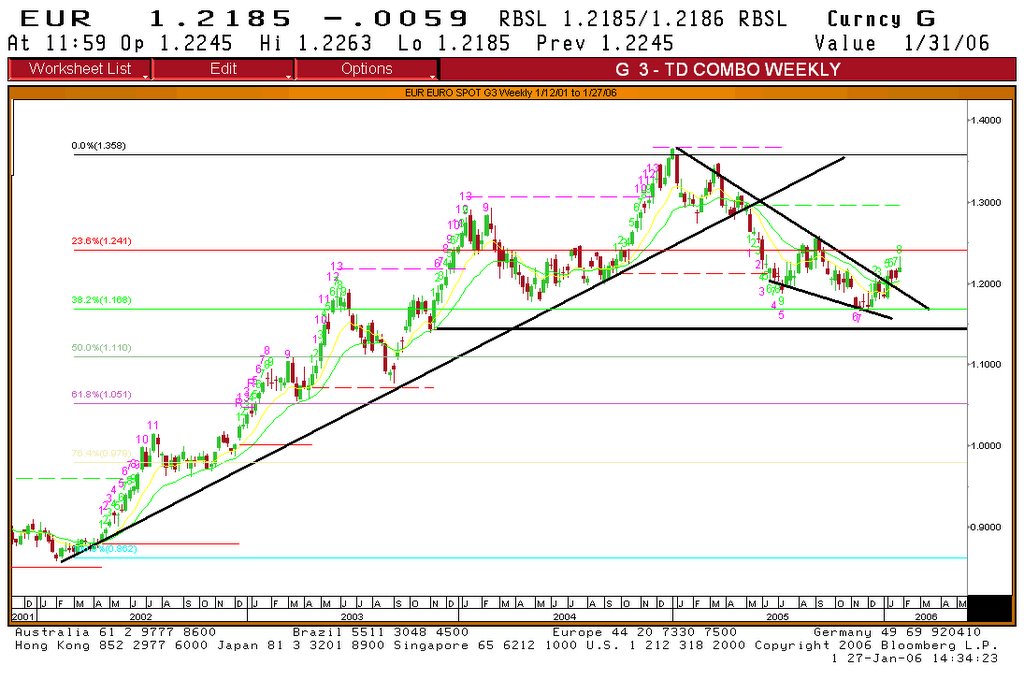
EURO-DOLLAR
The rate has probably reversed its downward trend, confirming wave 1 according to Elliott .The bullish reversal pattern and the breakout of two trend-lines of which one very significant (in red) opens bullish prospects for the Euro.The first objective is located around 1.25 and the second around 1.27.


