vendredi, février 23, 2007

Technical weekly 23022007

Equities
The Dow Jones Stoxx 600 Index has dropped from a six-year high this week as concern about rising inflation and borrowing costs in the U.S. outweighed better-than-expected earnings from some of Europe's biggest companies.
My view is that trends are still bullish but slightly weakening.
In the US, the latest reading of the Bull Ratio (AAII survey) finally showed investors turning optimistic. While not yet in excessive optimism, the series exceeded the level reached in April 06 and is at a 52-week high.


Another proof that the US stock market is over-extended is that over 80% of the stocks in the S&P 500 are now trading above their 20 and 200-day moving averages.
However we believe that in the mid-term this is a bullish sign of strength.
When some sector/industries perform better it is because there are positive news head.
In the US, transportation turned up with a good relative strength, which is good for the economy and the stock market.
The Consumer Discretionary and industrials sectors are also in an interesting bull market in Europe and in the US.
These sectors are leading indicator of consumption, and consequentially of the economy growth.
Finally I was still waiting for a break-out for the semiconductor index.
This is happening right now and that plays in favor of my (still) bullish view on equities.


In Japan, the Nikkei is showing remarkable strength.
And finally, after a period of 15 years trading in a descending range, the Nikkei took out its important resistance level.
Definitely a very bullish sign for the Japanese stock-market!
Supported by the rising momentum indicators further strength is still on the cards.


Bonds
Yields are consolidating in a symmetrical triangle.
I'm watching support and resistance levels for further indications.
The resistance is 4.15% and my mid-term target remains around 4.4% in the coming weeks/months.


Euro
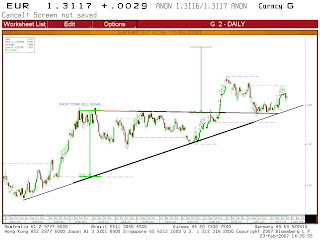
The failure to break above 1.326 indicates a consolidation.
But as long as the Euro remains above support zone, the outlook would remain higher towards 1.326.


Brent
Oil advanced to the highest level this year and the Brent is now breaking out above resistance, which means that the medium term downtrend is now over.
Momentum indicators favor further strength.


lundi, février 19, 2007

Technical Weekly 19022007

Equities
Stock returns have remained highly dispersed last week (it is a stock picking market); this was largely due to earnings reports or M&A rumors.
On the other hand, market breadth in the US, measured by the advance-decline indicator, has been very positive this year.
So far bulls have remained in control of the market and were able to maintain the DJ Euro Stoxx 50 above the 4200 support level.(arrow on chart 1)


These contained short-term pullbacks prove that the overall trend remains strong.
Technically speaking, the Nikkei 225 (chart 2) index is breaking through its May 2006 high
.


This is very bullish and further strength towards 18000 is on the cards.
The mid term target of the ascending triangle pattern is above 21.000 which is very impressive.
Unfortunately for European investors, the Yen is still caught in a bearish trend versus the Euro.
Finally we want the show you the mid term outlook for the DJ Euro Stoxx 50 according to the Elliott Wave theory and Fibonacci time projections.
The chart suggests that the final fifth wave will resolve in June around 4650.(7-8% upside).


Bonds
Yields were able to rebound on the 4% support zone but momentum is weak, which is why I doubt that yields will be able to rally above resistance in the coming days.
The resistance is 4.15% and our mid-term target remains around 4.4% in the coming weeks/months.


Euro
Last week I said that indicators were turning bullish for the Euro-dollar.
It is amazing to see that when volatility is very low, as Bollinger bands become narrower, the Euro is able to rally.
As you can see on the chart, in the past this kind of situation has often produced a new upside move.The short-term upside target is 1.326 and the mid-term 1.3775


Brent
The resistance line at 58 was too strong for the Brent and technically speaking the oil price performed a classic pull back to its established medium term downtrend resistance.
A retest of new low seen in January is a (strong) probability.


jeudi, février 15, 2007

Cumerio

Cumerio teste pour l'instant la résistance proche des 19 eur.

Une percée de ce niveau constituerait une ouverture vers les 21 dans un premier temps.


Le prix du cuivre semble également se stabiliser après avoir atteint l'objectif baissier du triangle descendant.

mercredi, février 14, 2007

Nikkey 225 Part 2

The Nikkey 225 broke throught important resistance line (in red).


This is very bullish and further strenght towards 18000 is on the cards.
However we you compare the Nikkey in eur versus the Stoxx 600 (black line), the relative long term is still in favor of the Stoxx 600
.http:///analysetechnique.blogspot.com/2007/02/nikkey-225.html
That is because the yen continues to fall and technically speaking I don't see any change of trend for now.

mardi, février 13, 2007

Fortis

Le titre vient de valider une sortie haussière en forme de triangle ascendant.

L'objectif de cours étant situé vers les 36.7 eur et le stop-loss en dessous de la résistance vers les 33.3 eur.

Bearish technical analyst

We turned bullish on equities and risky assets six months ago, and turned bearish about one month ago.
If a bubble is supposed to get bigger, the model usually picks it up, China has been our top position for a while (currently still hanging by a late thread).
The speculative rally in most global stock indexes, emerging markets and junk bonds should soon turn into a major liquidation.
Short term rallies are probably great selling opportunities and a last chance to get defensive beforte the consenssus wakes up to a market reversal.
Michael Belkin February 5, 2007.

lundi, février 12, 2007

Bullish technical analysts

New all time higs emerged across major indexes, including the Nyse, SP Mid and Small caps, the Russel 1000 and 2000, the DJIA and the Transports as well as the Dow utilities, with reaction highs in the SP 500 and the NASDAQ.
Technical indicators turned up, confirming the improvement.
Louise Yamada Technical Perspectives February 7, 2007.

Lowry’s statistics remains bullish.One of the best indicatons of weakness or growing weakness is the trend of new lows on the Nyse.
But we see that new lows have run below 40 all during 2007, and more recently new lows have run below 20.
This suggests very little downside pressure on the market ; in other words, few stocks are breaking down below important support.
And that is not bearish.
Richard Russel dow theory letters February 6, 2007.

In brief, virtually none of the classic warning signs tipically found in advance of major market top in the past are currently in evidence.
Our measurements of the forces of supply and demand have shown significant improvement during the past week, adding continuing confirmation to our August 30th intermediate trend buy signal.
During the past five trading days our buying power index has risen 27 poiunts to a new rally high, its highest level in more than 8 months, reflecting strong investor demand.
Lowry’s market trend analysis January 26 anf February 2, 2007.

The bottom line, we continue to buy weakness.There is not much risk here, and big potential if/when we get that final liberating optimism start to seep back in.
Don R Hays january 29, 2007.

Nikkey 225

The Nikkey 225 remains in a long term uptrend.(red line)
However we you compare the Nikkey in eur versus the Stoxx 600 (black line), the relative long term is still in favor of the Stoxx 600.


Technically the index may be close to a multi- month breakout but as you can see short-term momentum is falling.
The Nikkey 225 needs to clear the resistance line (in red) to improve the mid-term outlook.


Update www.the-intermarket.com

Interesting link and comments coming from Elio Zammuto.( www.the-intermarket.com)
My studies suggest that when some sector/industries perform better is because there are positive news head. Consumer Discretionary is one of the leading indicator of growth.
I'm still waiting for a break-out of semis, and then the picture will be complete.
Defensive industries are performing poorly. That plays in favour of my view.
In end, if the market change direction with visible signs, I'll change my mind.

Buy&Sell Belgium small caps biotech&medical products


Tableau "new energy"

Les actions de type énergies alternatives restent très bien orientées techniquement comme le montre le tableau ci-dessous.

Le vert prédomine largement et de nombreuses cassures à la hausse sont apparues récemment.A noter également le très important volume, preuve que ces valeurs intéressent de plus en plus les investisseurs.


Buy&Sell DJ Euro Stoxx 50

Bollinger breakout


Bollinger breakdown


vendredi, février 09, 2007

Technical weekly 09022007

Equities
The DJ Euro Stoxx 50 trades at the top of the three-year trading channel.
The long-term uptrend is still intact but positioned on the upper range of
this trend channel.(see chart below).


On a short term basis I still can find negative divergences between the price and indicators like the macd or the rsi.
All major indices all over the world are showing that same divergence in recent months.
This is a cause of concern because a trend consolidation should be expected according to this circumstance.
However, these kinds of divergences are frequent in long term bullish markets and what really matters is that the market is still making higher highs and higher lows.
I'm more prudent for the second part of the year.
That is because we are in a year that ends on a 7, traditionally bad years, especially the 2nd part of a 7 year.
Every time since 1900, the period between August and October of a 7-year was negative with an average decline of 13%.
Another reason is that according to the Elliott Wave theory, the stock markets are finishing a big 5th wave up. I expect them to hold up a few more months with media becoming more and more excited, but I will be extra vigilant in the second part of the year.

Bonds
No major moves this week, but yields were able to rebound on the 4% support zone. The next resistance is 4.15% and my mid-term target remains around 4.4% in the coming week/months.


Euro
The rate continues to trade sideways between 1.29 and 1.3.
It should state above 1.29 in order to keep the outlook bullish.
On the other hand momentums indicators are turning bullish and the volatility
is very low.
In the past this kind of situation has often produce a new upside move.The short-term upside target is 1.326 and the mid-term 1.3775


Brent

No change, the Brent is still trying to break the downtrend resistance line around 59.

jeudi, février 08, 2007

Divergences

As already explained many many times before, we can find negative divergences between the price and RSI/MACD... a rather bearish signal on the short term.
I'm always using the same index, but one thing is for sure: EXCEPT FOR THE BEL20 (let's say the Suez-index), ALL MAJOR INDICES ALL OVER THE WORLD ARE SHOWING THAT SAME NEGATIVE DIVERGENCE IN RECENT MONTHS!!!
I've never seen this before...!!!
Conclusion: markets are ready for a correction!(Stephan DEBRUYNE)


The long-term uptrend is still intact but positioned on the upper range of the trend channel. A trend consolidation is expected according to this circumstances and the negative divergences on most momentum indicators.
So be aware of some weakness in February/March.(Frédéric HEIREBAUDT)

lundi, février 05, 2007

Technical Weekly 05022007

Equities
Since the beginning of the year, European equities have been trading sideways.This is clearly visible when we look at the intraday chart of the DJ Euro Stoxx 50, which is a channel with a slight upward bias.


This channel is interesting for traders because they can buy when the index is oversold and sell when it is overbought.
For long term investors however, this market is more a stock picking one. The table below shows the best and worst performing stocks of the Stoxx 600 since the beginning of the year.


After the strong rise of the last months, I have been waiting for the possibility of a pullback.
However, last week’s rally is putting serious pressure on the upper edge of that horizontal trading range.
In summary, I expect the market to continue to work higher, as there are no sell signals amongst technical indicators at the present time.
Bullish positions can be maintained as long as the major technical indicators don’t give sell signals.


Bonds
Bonds rally last week and a pullback to the 4% level on the German Government Bonds 10 year yield seems now likely.
My mid-term target remains around the 4.4% in the coming week/months but I view this move as a cyclical recovery in a sustained long term downtrend.
The monthly chart below shows that the overall trend remains negative on German bond yields.


Euro
The Euro-dollar is testing support around 1.29, it should state above this level in order to keep the outlook bullish.


Brent
Two weeks ago, I said that at least a consolidation and quite possibly an oversold bounce could occur in the coming days for the Brent.
And now, after this steep rebound, oil is facing resistance below the down trend-line from August 2006.
I will closely monitoring this level in the coming days as the momentum remains positive.