vendredi, juin 30, 2006

Rally d’été?

Hier les marches d’actions ont validé un signal d’achat à court terme.
En effet sur le SP 500, la sortie haussière au-dessus des 1250 est validé par une longue bougie verte et aujourd’hui c’est au tour du DJ Euro Stoxx 50 d’essayer de franchir la résistance des 3600 points.
Cette reprise technique pourrait encore continuer quelques temps mais de nombreuses resistances sont proches.
Même si la tendance à court terme est positive il manque pour l’instant une chose importante càd l’augmentation des volumes.
Au niveau des indicateurs le Macd journalier est positif mais toujours négatif en hebdomadaire, ce qui signifie bien que ce movement est un movement de
contre-tendance.

mercredi, juin 28, 2006

Technical Weekly 28062006

EQUITIES
Equity markets rebound from oversold condition but technically speaking,
any rally attempt in the major indices should now be capped by strong resistances.
I still recommend a defensive posture and think that another down leg could be coming soon.
The chart below shows the DJ Euro Stoxx 50 trading below the 200 (yellow) and 50 day (green) moving averages, the bearish signal will be totally confirmed when the 50 day falls below the 200 day.
In conclusion, the massive oversold conditions that we saw in the last two weeks resulted only in a classic sharp, but I think, short-lived “V rally”.

If the index were to clearly close above 3600 then I expected to see this rally go to the 3750 resistance zone, but I still think that the bearish trend will reassert itself later.


COMMODITIES
Brent
Accelerates sharply up in the last few days and is now trying to break above the April high around 75$.

A break above the symmetrical triangle would be very bullish.


Gold
The support zone around 550$ was able to stop the decline.We believe that a stabilization process at this level may occur in the coming weeks before gold may try to resume his long-term uptrend.


GERMAN 10 YEAR YIELD
Is now close to resistance around 4.1%.A break above this level implies that there is a risk of seeing yields trading around 4.5% in the coming months.


EURO-DOLLAR
Close to support zone around 1.25.(red line)

On the weekly chart, you can see that as long as support around 1.25 holds, the outlook would remain higher towards a test of 1.30, which is a strong resistance.

mardi, juin 27, 2006

John Murphy

Vous trouverez ici http://www.etvmedia.com/etv/Custom/nybot/nybot_hub.jsp?movieid=23646&channel=354 une présentation récente très intéressante du "légendaire" John Murphy" concernant l'analyse inter-marché.

lundi, juin 26, 2006

Allocation d'actifs et marchés financiers

D'après Martin Pring et Elio Zammuto, les marchés financiers seraient actuellement en "Stage 5" cad, les obligations et les actions baissières.
Plus d'infos sur http://www.the-intermarket.com et http://www.pring.com.
Le tableau ci-dessous nous montre que le risque/return est historiquement très mauvais pour les actions (en bleu) en "stage 5".


Sratégiste US

La plupart des économistes restent très positifs et il en va de même pour les stratégistes.
Le graphique nous montre l'allocation en actions recommandée par les brokers et grandes banques d'affaires aux USA.(en jaune et le SP 500 en noir)
Nous pouvons constater deux choses importantes :
Premièrement la pondération en actions a augmenter depuis la fin avril et deuxièment, si l'on se base sur le passé comme guide, il s'agit plutôt d'un indicateur contraire!


jeudi, juin 22, 2006

Scénario de marché sur l'Euro Stoxx 50

L’Euro Stoxx 50 connait pour l’instant un rebond à court terme faisant suite à la forte baisse débutée début mai.
Mon scenario de marché est le suivant : si on part du principe que le nous nous trouvons dans une phase de consolidation et que la première vague de baisse est terminée (vague A), nous pouvons maintenant tabler sur une reprise technique.
Celle-ci a déja commencée et devrait pouvoir encore continuer dans les prochains jours voir les prochaines semaines.(vague B)
Malheureusement il y a de bonnes chances pour que l’indice s’essouffle dès qu’il se rapprochera de zones de resistances.(d’abord 3600 ensuite 3770).
Je table sur une correction flat en 3-3-5, ce qui veut dire qu’une deuxième phase de baisse (vague C- ligne rouge) se produira plus tard (juillet?) avec comme principal objectif la zone de support vers 3200.(ligne verte).Pour l’instant il y faut donc surveiller de très près le rebond en forme de V et la cassure éventuelle de la droite de tendance haussière en pointillée sur le graphique.

mercredi, juin 21, 2006

Analystes techniques

A lire un article intéressant sur le site de Martin Pring (http://www.pring.com) : The return of the Bear.Grrrr!


Quelques commentaires sur l'Euro Stoxx 50 de Jean-Christophe Dourret, analyste technique chez Oddo :

Réalisation complète, au premier trimestre, du potentiel haussier d’un mouvement mesuré ascendant à long terme …

… à la suite de quoi un cycle de consolidation s’est ouvert à moyen terme.

À court terme, une reprise technique prend forme.


mardi, juin 20, 2006

MACD SP 500

L'indicateur Macd en mensuel sur le SP 500 vient de donner un signal négatif pour la première fois depuis le début de l'année 2000!
Ceci demande confirmation à la fin de ce mois mais pour l'instant il faut mieux rester prudent.

lundi, juin 19, 2006

Technical Weekly 19062006

EQUITIES
Only 48% of the 600 stocks of the DJ Stoxx are trading above the 200 day moving average and only 11% trade above the 50 day moving average.
This last number is very low which means that the market is very oversold but the first one indicate that the intermediate term is still bearish.
I think that a sharp but short-lived rally is occurring because:
-The SP 500 (see chart below) declined sharply over thee last six weeks, but the pattern looks like a classic ABC Elliott wave correction and support is near.(1200) - from a contrarian point of view, sentiment is now outright bearish on US equities, which suggests that the consensus already widely discounts a continuation of the recent decline.

-for instance, bearish sentiment amongst US retail investors reached its highest level since April 2005.


COMMODITIES
Brent
Broke below the 67$ and the 50 day moving average, which means that I change our short-term bullish view to neutral.

I will watch closely the next major support, which coincides to the zone of the 200 day moving average and the ascending support trend-line in red on the chart below.


Gold
Sharply accelerates to the downside and trades now close to the critical support around 550$ and close to the 200 day moving average.
Gold has now decline more than 20% in just five weeks!

I believe that a stabilization process around this level may occur in the coming weeks.


GERMAN 10 YEAR YIELD
No clear signal at all. A flight to safety has supported bond markets over the last days and the German 10 year yield is still challenging an important up trend-line around the 3.9% zone.

On the other hand there is still a risk of seeing yields trading around 4.5% in the coming months.


EURO-DOLLAR
Close to support zone around 1.25.(red line)

On the weekly chart, you can see that as long as support around 1.25 holds, the outlook would remain higher towards a test of 1.30, which is a strong resistance.


mercredi, juin 14, 2006

WAVES

On a weekly basis you can see on the charts that we are still in Wave A (first leg down).
On a daily basis I think it is less clear because this could still be wave A but also Wave C.
The correctives waves are always more difficult to predict.
The more bearish correction is the Zig-Zag.(5-3-5)
The 2 others corrections (the flat (3-3-5) and the triangle) are more consolidations patterns.


My guess is that the market is correcting a 3 years bull market and so I expected another wave down and a Zig-Zag pattern.
Some guidance : C is is often as long as A.
C is often 1.62 (or 1.38) X A.
So, it is very important to see if Wave A on the weekly chart is a 3 (flat = small correction) or a 5 moves down (zig-zag= deeper correction)
For now I only see 3 moves down on most indices.

Conclusion : I will closely monitoring the next rally before making hasty conclusions.
My interpretation :SPX support zones : 1210 and 1090 beware that the advance from 2003 looks like a rising wedge and a break below 1300 may trigger quick losses.
DJ Euro Stoxx 50 :close to support next one difficult to see but beware this could be a big ( head and shoulder) top pattern.


Waves

On a weekly basis you can see on the charts that we are still in Wave A (first leg down).
On a daily basis I think it is less clear because this could still be wave A but also Wave C.
The correctives waves are always more difficult to predict.
The more bearish correction is the Zig-Zag.(5-3-5)
The 2 others corrections (the flat (3-3-5) and the triangle) are more consolidations patterns.


My guess is that the market is correcting a 3 years bull market and so I expected another wave down and a Zig-Zag pattern.
Some guidance : C is is often as long as A.
C is often 1.62 (or 1.38) X A.
So, it is very important to see if Wave A on the weekly chart is a 3 (flat = small correction) or a 5 moves down (zig-zag= deeper correction)
For now I only see 3 moves down on most indices.

Conclusion : I will closely monitoring the next rally before making hasty conclusions.
My interpretation :SPX support zones : 1210 and 1090 beware that the advance from 2003 looks like a rising wedge and a break below 1300 may trigger quick losses.
DJ Euro Stoxx 50 :close to support next one difficult to see but beware this could be a big ( head and shoulder) top pattern.


lundi, juin 12, 2006

Technical Weekly 12062006

EQUITIES
The Euro Stoxx 50 continues to decline and trades now below the 200 day moving average.
Last week the index has completed a bearish “pennant” continuation pattern, which means that a deeper correction is expected in the coming weeks.
The fact that the index has not (yet) been able to initiate a significant technical bounce is a cause of concern.
But, due to significantly oversold daily conditions, there may be a technical bounce in the near term.
However, I do not believe that such relief rallies are likely to be sustained.
The chart below shows the DJ Euro Stoxx 50 with three momentums indicators (Macd).
The daily one is very oversold but gives no buy signal yet.
The weekly (mid-panel) is bearish and continues to fall.
The monthly one, which is the more important is still rising but weakening.
Technically speaking traders have no more the “buy the dip” mentality and will now surely “sell the rally”.This behaviour can be seen in the next chart as the commercials (“smart money”) are now extremely short while “small traders”(yellow line) have increased the size of long positions
.


COMMODITIES
Brent
The brent continues to consolidate around 70$ giving no clear short-term signal.

The long-term trend is still positive but a break below 67$ would change this view.


Gold
Is now close to support around 600$.

This psychological level could attract buyers but the most important support level is located in the 550$ zone.


GERMAN 10 YEAR YIELD
The German 10 year yield is challenging an important up trend-line.
If this support doesn’t hold we have here a high probability of a change of scenario.The weekly momentum is also close to give a sell signal, which means that a test of the 3.8% in the coming weeks seems likely.
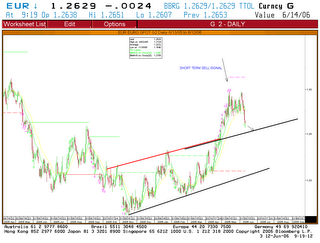


EURO-DOLLAR
The short-term correction continues and may extend towards the first support zone. (see arrow on chart)
But as long as support around 1.23 holds, the outlook would remain higher towards a test of 1.30, which is a strong resistance.

A move back below 1.23 would negate this bullish view, and suggest a test of the long- term support line, which currently lies at 1.2100.

mercredi, juin 07, 2006

Correction sur les bourses Européennes et indicateur TD Combo.

L’indicateur TD Combo (nombre 13 et flèche sur les graphiques) a bien signalé la forte probabilité d’avoir une correction sur le DJ Stoxx 600.
En effet un signal de vente est apparu en avril sur les différents horizons de temps à savoir en mensuel (graph1) en hebdomadaire (graph2) et en journalier (graph3 signal de vente fin mars)!