vendredi, février 24, 2006

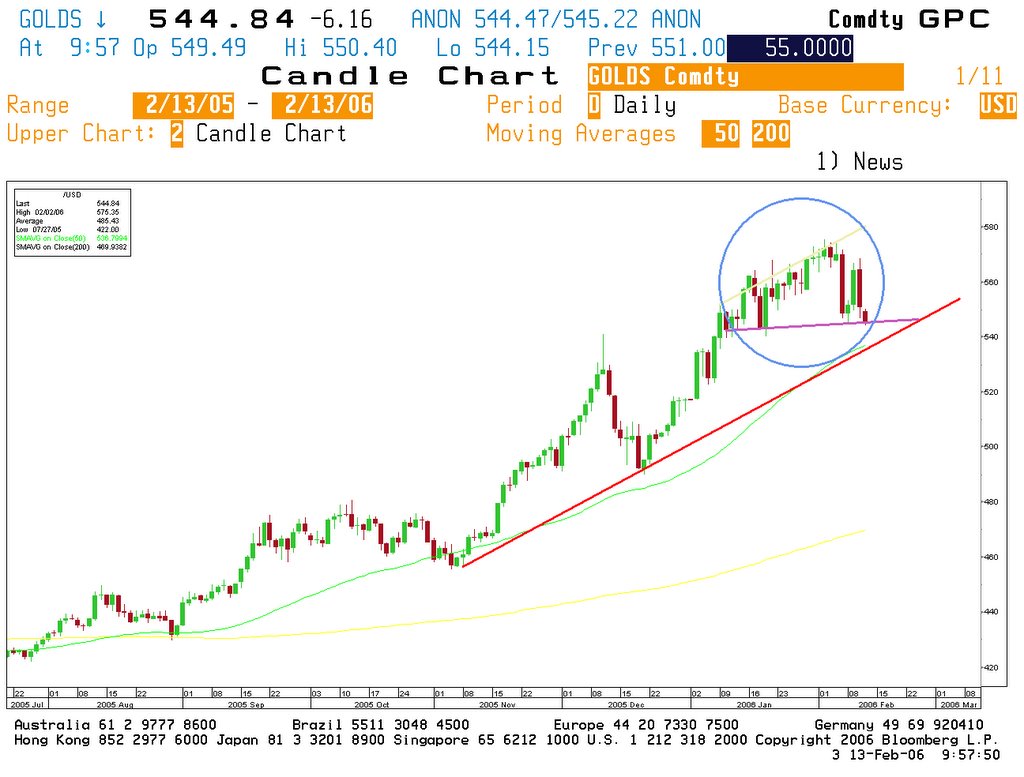
Cycliques ou défensives?

La composante future de l’indice IFO en Allemagne vient d’atteindre un nouveau plus haut depuis octobre 1994.
Le graphique ci-dessous nous montre une correlation quasi parfaite entre d’une part l’IFO (Business Expectation) et d’autre part un ratio entre les valeurs cycliques et les valeurs defensives.(Stoxx Basic Resources/Stoxx Food&Beverage)La conclusion : il serait peut-être intéressant de prendre quelques profits sur les valeurs cycliques et de revenir progressivement vers les valeurs defensives.

Technical Weekly 24022006


EQUITIES
Earnings development in Europe remains strong and the Dow Jones Stoxx 600 closed at a 4 ½ year high last week.
New M&A developments are still bullish for the market.
In the short term the uptrend is likely to persist and nothing seems able to stop the index from rising right now.
In the US the SP 500 is close to break above the 1300 level, which is a significant resistance.
However euphoria is dangerous and the continuation of a steep uptrend could end in a buying climax that is likely to be followed by a major correction.
The chart below shows the Nikkey 225 testing the 15400 support zone.A break below this support will put Japan at risk for further underperformance in the coming weeks
.


COMMODITIES

Brent
The Brent trades now above the 200 day moving average, but the upside move last week was not so impressive.
I expect a consolidation at this level. Meanwhile price could test the minor resistance (green line) around 60.3$ in the coming days and if this scenario takes place the target will be a rally towards new highs.


Gold
Gold seems to stabilize around the 550$ level. The short -term correction may not be over and a drop to the 540$ level is still possible.However, the mid-long term outlook remains bullish.


GERMAN 10 YEAR YIELD
The consolidation continues and the bond markets are tracing out the rebound that I was looking for to lead to an upside target around 3.7-3.8% for the German yield in the coming weeks.However in the coming days, a continuation of the current consolidation remains the most likely scenario
.


EURO-DOLLAR
Nothing-new last week as the rate continues to trade sideways.
Short- term volatility remains low.I still expected limited downside potential from here as the rate correct 61.8% from the November to end January bullish move, which is a normal process.

lundi, février 20, 2006

Technical Weekly 17022006

lundi, février 13, 2006

Technical Weekly 13022006

EQUITIES
The overall trend remains bullish especially on European and emerging markets regions.
The Russian RTS index for instance has risen 19.5% year to date, Brazil (17%) and China (17%) are not far away.
In the US, the SP 500 is now close to support and I think that the index may continue to trade sideways in the coming weeks.
Interesting moves last week came from sector rotation as I have seen the “oversold” telecom sector attracting bottom fishers and on the other hand, some profit taking were taken in the oil&gas and basic resources sector.
The graphic below of the Euro Stoxx 50, shows that prices are stabilizing around the 3700 level.
For several weeks, the index has been rising sharply and a consolidation is a normal process.A sharp decline seems unlikely because the “buy the dips” mentality still prevails for investors.


COMMODITIES

Brent
Brent has corrected last week and the support line is now in danger.
Oil prices have fallen 9.4% this month.However as you see, the long- term trend is still up for the Brent
.


Gold
The pullback that I was waiting for is finally happening.
Tuesday’s sell off confirmed this view.
The first support is 545$ but I will watch closely the potentially bearish “right angle broadening pattern” (see circle on the chart below).


GERMAN 10 YEAR YIELD
After a strong rise towards 3.5%, yields are consolidating and could retest the 3.37% level soon.(see arrow on chart)

Long term and mid term momentums are up and that is why I believe that a new bearish wave remains possible with a probability of further upside towards 3.7%-3.8%.


EURO-DOLLAR
The Euro-dollar is pulling back below the 1.2 level but we expected limited downside potential from here because of the presence of a strong support in this zone.
I view this as a counter trend move and I think that the upside still prevails.

This is a weekly chart showing the breakout from a falling wedge pattern.

mercredi, février 08, 2006

Retournement en vue?

De nombreuses classes d'actifs sont proches de points pivots importants.
Par exemple 1250 sur le SP500, 60$ sur le Brent, 1.195 sur l'eurodollar, différence entre le 10 ans us et le 3m us proche de zéro (courbe des taux) etc...

Je pense que ce n'est pas trop le moment de prendre de gros paris mais plutôt de surveiller de très près les marches d’actions pour voir si les acheteurs reviennent à ces niveaux.

mardi, février 07, 2006

UCB

UCB semble sortir à la baisse d’un large triangle descendant.Attention toutefois, une fausse cassure s’étant déja produite en décembre 2005.

lundi, février 06, 2006

CUMERIO DEXIA IBTB

Cumerio rebondit fortement sur la moyenne à 20 jours.


Dexia accomplit un nouveau plus haut historique sur fonds de consolidation du secteur bancaire européen.


Après avoir formé un “rounding bottom” long terme, le cours d’IBTB accélère fortement.

STOXX TELECOM&BASIC RESOURCES

L’écart entre le secteur Stoxx le plus performant Basic Resources et le moins performant à savoir les Telecom ne cesse de croitre.


Sur le deuxième graphique en mensuel on peut voir que le potentiel de la figure en triangle symétrique a été atteint sur le secteur des Basic Resources.
Néanmoins aucun retournement de tendance ne semble visible pour l’instant.


Pour les Telecom le graphique long terme est tout autre puisque nous observons clairement une cassure de la droite de tendance haussière en place depuis juin 2002.De plus le Macd semble proche de donner un signal de vente majeur.
Enfin et suivant le décompte des vagues d’Elliott le secteur Basic Resources serait toujours en vague 3 alors que le secteur des Telecom serait déja en vague 4.

Donc en conclusion je continue à surpondérer des titre lies aux matières premières et à éviter le secteur des Telecom en général.