vendredi, septembre 28, 2007
mercredi, septembre 26, 2007
Base metals&oil and gas
As the price of the industrial metals continue to fall (-2.78% YTD in €), the DJ Stoxx basic resources continues to rise.(+37.12% YTD in €)
May be there is a buying climax on metal&mining stocks but for now the trend remains strong.
Another interesting intermarket relationship is the recent decoupling between oil price and natural gas price.

Publié par
HEIREBAUDT FREDERIC
à
9:23 AM
0
commentaires
![]()
Libellés : MATIERES PREMIERES
vendredi, septembre 21, 2007
Technical weekly 21092007
Equities
This week the SP 500 and the DJ Euro Stoxx 50 exceeded significant resistance zone in strong volumes.
As I said last week they are likely to extend their long-term uptrends and rise to another new all time high.
Very oversold sectors like banks and construction rebounded sharply but technically speaking we do not think it is time to overweight those sectors.
My favorite sectors remain food&beverage, telecom, Oil&gas and technology.
The rally in the basic resources sector is impressive but this sector is now very overbought.
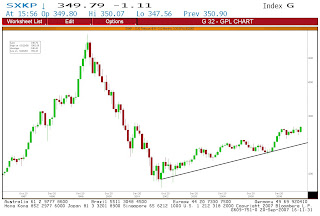
The monthly chart below is the DJ Europe Stoxx technology.(chart1)
Since then it has maintained a progression of rising major reaction lows in what has been a relatively gradual uptrend.

The breakdown below the 4.2% support level was a bull trap for bonds holders and yields rebound strongly after they completed a TD Sequential low risk buy signal.(green arrow on chart).This event cancel my downside target of 3.7% and I have now an upside target of 4.6% for the coming weeks.


The euro broke its long term rising resistance line at 1.4000.The rate is now overbougt but I think a target of 1.43-1.44 is likely for the coming weeks.

Publié par
HEIREBAUDT FREDERIC
à
10:47 AM
0
commentaires
![]()
Libellés : TECHNICAL WEEKLY
jeudi, septembre 20, 2007
Long term sectors charts (Stoxx)
Sometimes looking at long term monthly charts
can give you a good perspective where the money is flowing.
Publié par
HEIREBAUDT FREDERIC
à
4:54 PM
0
commentaires
![]()
Libellés : SECTEURS
€/$
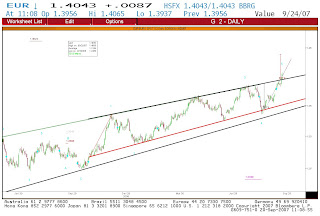
The euro broke its long term rising resistance line at 1.4000.
Elliotticians often calculate Fibonacci extensions to project the length of Elliott waves.
In this case, the fifth and the first wave patterns are often equal which means a minimun target between 1.43 and 1.44 for the coming weeks.
If we report the width of the long term bullish channel to the breakout, we arrived at the same target
Publié par
HEIREBAUDT FREDERIC
à
11:12 AM
0
commentaires
![]()
Libellés : DEVISES
mercredi, septembre 19, 2007
SP 500 bullish breakout
Yesterday the SP 500 validates a bullish pattern on high volumes.(some analysts see a triangle others an inverse head and shoulders)
Moreover the index was able to break above 2 important resistances and reintegrates the long term bullish channel.
The target of the pattern is around 1600 and possibily higher (top end of the channel)
Publié par
HEIREBAUDT FREDERIC
à
8:53 AM
0
commentaires
![]()
Libellés : INDICES
vendredi, septembre 14, 2007
Technical weekly 14092007
Equities
If the big indices are able to break above key resistances it are likely to extend their long-term uptrends and rise to another new all time high.
Volumes are still very low and in this difficult market stocks and sectors picking are key.
Strong sectors are unchanged, Food&beverage, Oil&gas, Telecom and Technology.Financials and banks continue to underperform and I also see weakness in the Construction sector.

Yields are breaking down below a very important support level what implies that I change my view on bonds.
Technicaly speaking the picture is now more neutral for the bond market.
The downside risk and the target of the pattern could be around 3.7-3.65% for the coming weeks/months.On the other hand yields are very oversold (green arrow on chart) which means a rebound is now developping.

Last week I said that : further good progress is expected towards the 80 $ resistance zone. So here we are, and this week we want to show you a long term weekly chart.
As you can see according to the Elliott wave theory, we are now in the beginning of wave 3, which is usually the largest and most powerful wave.
If we copy exactly (amplitude and rate of ascent) the last upward movement of the preceding wave 3, we arrive at a target of 150$ for February 2009!
This corresponds to the higher uptrend-line of the long term rising bull channel.

The uptrend remains intact, but the target which is the upper rising trendline is now reached.
Moreover, TD Combo&Sequential indicators are now flashing a low risk overbought sell signals.(red arrows on the chart).

Publié par
HEIREBAUDT FREDERIC
à
2:41 PM
0
commentaires
![]()
Libellés : TECHNICAL WEEKLY
jeudi, septembre 13, 2007
Ranking Stoxx sectors
Sector rotation model for the Stoxx sectors.
Overweight Telecom, techno, basic, food and oil.
Underweight Real Estate, Financials, banks,Construction and Travel&leisure.
Publié par
HEIREBAUDT FREDERIC
à
3:05 PM
0
commentaires
![]()
Libellés : SECTEURS
Buy&sell signals
Publié par
HEIREBAUDT FREDERIC
à
2:10 PM
0
commentaires
![]()
Libellés : SIGNAUX
mardi, septembre 11, 2007
Banks are oversold
TD Sequential 13 low risk buy signal on banks.(green arrow)
The DJ Europe Stoxx banks and the US KBW index are very oversold.
Publié par
HEIREBAUDT FREDERIC
à
2:16 PM
1 commentaires
![]()
Libellés : SECTEURS
lundi, septembre 10, 2007
Long-term yields are falling
Changing my opinion for bonds as the bund in yield is breaking down below
the 200 day MA and below important supports.
Mid-term target now around the 3.65-3.7%.
Publié par
HEIREBAUDT FREDERIC
à
5:01 PM
0
commentaires
![]()
Libellés : INDICES
Agriculture
The DJAIG Agriculture index recently made a bullish breakout exceeding new highs.
According to Bloomberg, here are the performance YTD for the best performer commodities
AGRICULTURE : +9.26% 
WHEAT : +58.68%
GRAINS : +18.92%
SOYBEAN : +22.38%
SOYBEAN Oil : + 18.99%
COCOA : + 7.03%
According to an US newspaper, over the past year :
milk up 21%
chicken breast up 12%
coffee up 12%
ground beef up 11%
The last US CPI (YOY) was 2.4%
So, Inflation is dead! (unless you eat)
Publié par
HEIREBAUDT FREDERIC
à
2:38 PM
0
commentaires
![]()
Libellés : MATIERES PREMIERES
vendredi, septembre 07, 2007
Technical Weekly 07092007
The short-term recovery remains in place. If the SP 500 can break above key resistance at 1490 it is likely to extend its long-term uptrend and rise to another new all time high.
The pattern looks like an inverse head and shoulder pattern but needs to be confirmed because the neckline has not been broken yet.(chart 1) 
On the negative side volume has been very low, this suggest that this technical recovery could end soon.
The downside risk is a move below the 1460 level that could imply a retest of the recent low around 1370.
Note that the Banks sector markedly underperformed the broad indices, the sector’s largest component in the US, Citicorp, in fact, making new lows in relative terms this week.
On the contrary the DJ Europe Stoxx Technology made a new high in relative terms.
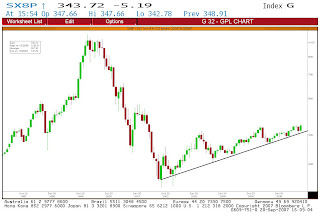
An absolute break above the 345 resistance level would be technically very bullish.
In Europe Nokia and SAP have great charts.
We think that equity markets will remain volatile in the coming months.
Sector and stocks picking will be very important and as you can see in the tables below there are huge differences between sectors returns since the beginning of the year.(SP 500 table 1 and STOXX table 2)


Bonds
Bonds yields are testing support around the 4.2% level.
This is a very important technical level which includes the 200 day moving average.(in green) I suspect that the correction is over and that renewed strenght may follow soon.

Brent
After a rebound on the 68 $ support, further good progress is expected towards the 80 $ resistance zone.(rectangle on the chart)A break above this year’s high would be very bullish.

After having validated a minor double top pattern in July the rate rebounds on the 1.343 support level.
The uptrend remains intact, with the upper rising trendline as next target/resistance levels.

Publié par
HEIREBAUDT FREDERIC
à
10:45 AM
0
commentaires
![]()
Libellés : TECHNICAL WEEKLY
jeudi, septembre 06, 2007
STOXX sectors
Stoxx sectors to overweight (in green) and to underweight (in red) based on relative strength.
"click on the table to enlarge"
Technical scoring based on different moving averages (from to 10 points) for the Stoxx sectors
Publié par
HEIREBAUDT FREDERIC
à
2:47 PM
0
commentaires
![]()
Libellés : SECTEURS
Bullbear
Interesting study coming from Bespoken (http://bespokeinvest.typepad.com/bespoke/)showing the historical bull and bear markets of the SP 500.
Publié par
HEIREBAUDT FREDERIC
à
12:05 PM
0
commentaires
![]()
Libellés : SENTIMENT
Classement recherche AQR
Voici selon AQ Research le classement de la meilleure recherche européenne en actions.
C'est un classement qui compare tout type d'analyses techniques ou fondamentales.
1- DZ bank
2- ESN
3- DayByDay
4- LBBW
5- Dresdner
6- Kepler
7- Citigroup
8- Oddo
9- ABN
10- UBS
11- Charles Stanley
12- Goldman Sachs
Publié par
HEIREBAUDT FREDERIC
à
10:45 AM
0
commentaires
![]()
Libellés : LIENS/ARTICLES
mercredi, septembre 05, 2007
Analyse technique
L'analyse technique cela fonctionne.La preuve avec DayByDay spécialiste en finance comportementale (http://www.daybyday-pro.com/) qui est maintenant classé 3ème meilleure recherche européenne en actions au dernier classement AQ Research. (en seulement 6 mois de participation !).
Publié par
HEIREBAUDT FREDERIC
à
4:50 PM
0
commentaires
![]()
Libellés : LIENS/ARTICLES
Dexia
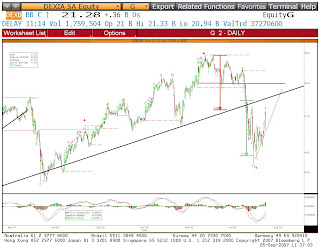
Aprés avoir validé plusieurs signaux de vente : le premier en avril (flêche rouge indicateur TD Combo), un double top en juillet et finalement (et le plus important) une cassure de la droite de tendance haussière qui prévalait depuis mai 2004, le titre est parvenu à rebondir sur l’objectif des 19€.
Ce signal d’achat également validé par l’indicateur TD Combo (flêche verte) est toujours valable et la reprise technique pourrait se poursuivre avec comme objectif l’oblique haussière (devenue une importante résistance) vers les 22.3€.
Publié par
HEIREBAUDT FREDERIC
à
11:38 AM
0
commentaires
![]()
Libellés : SIGNAUX
The return of techno?
Recently, the DJ Europe Stoxx Technology made a new high in relative terms (ratio vs STOXX index in black).An absolute break above the 345 resistance level would be technically very bullish.In Europe NOKIA and SAP have great charts.
In the US, APPLE CISCO and ORACLE are stongly trending upwards.
Publié par
HEIREBAUDT FREDERIC
à
10:15 AM
0
commentaires
![]()
Libellés : SECTEURS
Arbitrage en pétrolières
Achetez de sociétés pétrolières qui profitent de la hausse des investissements dans l'exploration et la production et vendez les "majors".


Par contre SAIPEM TECHNIP et GEOPHYSIQUE surperforment l'indice de façon constantes et régulières.


Publié par
HEIREBAUDT FREDERIC
à
8:57 AM
0
commentaires
![]()
Libellés : SECTEURS


