lundi, avril 30, 2007

CHINA

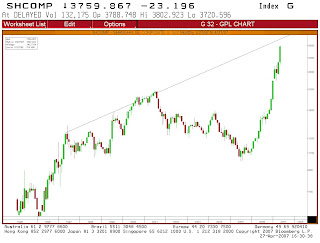
China is becoming technically speaking very dangerous.

As you can see on the charts the move is becoming parabolic, movements like this one always provoke a sharp reversal back down.

vendredi, avril 27, 2007

New highs relative to the Stoxx 600

This is a list of stocks that recently made a new high against the STOXX 600.
Technical analysts consider new highs as a bullish event.

Click on the table to enlarge

Sectors and relative strength

In attachment you will find 3 Stoxx sectors.

The colour coding on the charts is based on the position of the relative chart.
Red below 20 and 50 days moving averages = bearish
Blue in between = neutral
Green above 20 and 50 days moving averages = bullish.
This give me a clear view of the changing sector rotation.
As you can see the industrials(chart1) are bullish and the telcos(chart3) are still bearish.(chart2)
The banks have just turn bullish
.

jeudi, avril 26, 2007

How to find stocks with the best upside potential?

In these report of the STOXX 600 members, I scan 3 key ingredients :
1 the stock must be in an uptrend
2 Upside targets is at least 3 times further from the price than the stop (risk/reward>3)
3The target price is at least 10% away.
26 stocks meet this criteria today.

click on the table to enlarge


mercredi, avril 25, 2007

Top in June?

Last year in December
http://analysetechnique.blogspot.com/search?q=sequence and in the beginning of February I showed you some charts of the STOXX and the Dj Euro Stoxx50 based on Fibonacci sequence.


These 2 charts suggested that the 5 and final wave will resolve in June 2007 (top)
For now I don' t see any reason to change this scenario but the upside potential for European markets seems limited.

lundi, avril 23, 2007

This long term chart coming from Metastsock is a long term trading system design to anticipates turning points, maximize long term return while reducing downside risk.
As you can see the results are quite good.


click on the chart to enlarge

So for now we can't deny the momentum is still to the upside for the time being.
The DJ Euro Stoxx 50, SP500, MSCI world all made new fresh technical breakouts last week.
Technically, it would be challenging to find fault with this new continuation rally on an increase in volume with higher highs and higher lows.
So, for me the conundrum is: 1)equity index are overbought (14 day RSI on the DJ EURO Stoxx 50 is above 70).
Being overbought has not always been problem the last several months, though it was a horrifying problem in late February.
2) Solid earnings have hit these markets, this coupled with positive M&A activity, you have the makings of a rally.
But the intermarket picture is worrying with long term rates on the rise and $ falling.
3)the trend is so strong with new highs on most indices but the danger for the equity markets may be coming from the Chinese market as the trend for the CSI 300 index is now turning parabolic and as the daily TD combo and TD sequential indicators are just recently flashing sell signals (this was also the case in mid February).

jeudi, avril 19, 2007

Technical Weekly 19042007

Equities
The DJ Euro Stoxx 50 validates a bearish rising wedge pattern, which means that a pull-back to support zone around 4270-4260 on the DJ EURO STOXX 50 seems likely in the coming days/weeks.


The overall trend remains positive (most trading indicators on buy -table1) but after a strong acceleration during the last four weeks, the index needs a rest.
The first support zone on the hourly chart is 4300.


The danger for the equity markets may be coming from the Chinese market as the trend for the CSI 300 index is now turning parabolic and as the daily TD combo and TD sequential indicators are just recently flashing sell signals (this was also the case in mid February).


Bonds
The German 10 Year yield recently broke through the 4.1% resistance zone but started a pull-back towards this zone. (short term sell signal –arrow on chart).
Nevertheless I keep my target of 4.5% for the coming weeks.


Brent
Last week I said that the Brent must first correct his overbought status before another up-leg can begin.
A rebound on the lower trend-line channel (in green on the chart) could be the trigger for a rise towards the upper trend-line channel.


Euro
My first target of 1.36 is already reached and the Euro dollar remains in a very strong bullish trend.
However, we do not believe that the next target will be reached immediately because technical indicators are now very overbought. (red arrow on the chart).
A consolidation is more likely in the coming days.


jeudi, avril 12, 2007

Inflation?

Ferrous Scrap was one of Mr Greenspan's favourite indicators.
Prices have broken up recently, which could suggests that inflation remains a risk for central bankers.
Copper and industrials metals index (GYX on Bloomberg) are also breaking out.


The expected inflation in the US is also rising.

mercredi, avril 11, 2007

Technical Weekly 11042007

Equities
The DJ Euro Stoxx 50 has already reached the target of the double bottom pattern around 4300.
The 4300-4320 resistance level is an important level to watch because after dropping in the first two weeks of March, markets are making a rebound towards the February-highs.
Every technical analyst knows that the time to worry is not on the initial decline but on the failure to post a new high.
The concern we see here though is evident; the 9 days RSI indicator is now trading above 70, which means we are now back into 'overbought' status.
Being overbought has not always been problem the last several months, though it was a horrifying problem in late February.
With both of those possibilities in view (breakout above new highs or correction of the overbought status), we are not going to take big “bets".
However, it does not change the fact that the momentum is currently with the bulls but to become more bullish, we need to break above resistance level.


Bonds
On the last weekly I said that a break above the two resistance lines (green and gold lines) would be very bearish for bonds.
You will find an update of this weekly chart of the German Government Bonds 10 year yield below.
For a more detail picture, we also include the daily chart which shows what it appears to be a new bullish (bearish) leg for yields(bonds).


Brent
Short term target remains 77-78$ in the coming weeks but the Brent must first correct the overbought status which is showing on the chart by the TD Combo indicator.
As you can see the two last signals were pretty accurate.
We advice to buy the dips when the price touch the up-trendline (in green on the chart).


Euro
No change, my targets in the coming weeks remain 1.36 and then around 1.38.
In order to keep the outlook bullish the rate should hold above the ascending up-trendline (red arrow on chart).