jeudi, mars 29, 2007

Be carefull on bonds?

It is a good time to watch bonds very closely because the Eurobund is approaching critical support around 114.7-114.6 (4.1%).
The first chart is a daily one showing a big descending triangle pattern with an Macd indicator already bearish.


My concern is that I don't see much support if this last one is broken down and more important to me it seems that the very long term uptrend (montly chart since 1990) is over.

mardi, mars 27, 2007

Buy&sell Dj Euro Stoxx 50

All trending indicators on sell.


Bullish breakout.


Technical Weekly 27022007

Equities
The short-term rebound seems to be over as momentum is now weakening.
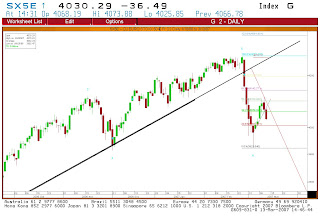
The hourly chart below shows the DJ Euro Stoxx 50 with three indicators (RSI,Macd and TD Combo) that are already in bearish mode.
As the index approach the February highs, most short–term indicators were already at overbought levels therefore short-term profit taking was a high probability.
As you can see the up-trendline is now broken meaning that I still believe there is a risk of seeing another bearish move (wave c on the daily chart) in the coming days/weeks.
The support level to watch for the DJ Euro Stoxx 50 is unchanged at 3900.


Bonds
The German 10 year bund yield rebounds on the 3.9% up-trendline ; this is clearly visible on the weekly chart below.
A break above the two resistance lines (green and gold lines) would be very bearish for bonds.


Brent
Closed at their highest level in more than two weeks, buoyed by mounting tensions between Iran and the U.K.
Technically speaking the Brent validates a bullish ascending triangle pattern (some people may seen an inverse head an shoulder pattern), which means that the short term target could be 77/78$ in the coming weeks.


Euro
Still bullish above 1.326 ; the outlook remains higher above 1.37 in the coming weeks.

jeudi, mars 22, 2007

DJ Euro Stoxx 50

After the quick &sharp correction a couple of weeks ago, markets were trapped in a narrow range for a while.
We are now breaking out of this range on the upper side (double bottom pattern-see hourly chart) looking for a retest of the 2007-highs.
The target of this pattern is above 4300 (4% upside potential)
Let's first see what happens near the February 2007 highs, because the previous support is now resistance on the daily chart.

mardi, mars 20, 2007

Double bottom?

L'indice DJ Euro Stoxx 50 est toujours en phase de rebond à court terme.

Sur le graphique horaire on peut constater la formation d'une figure en double fonds.
Celle-ci ne sera toutefois validée qu'au dessus des 4100 points (ligne rouge).
L'objectif théorique se situant vers les plus hauts de l'année.
Attention toutefois, une cassure de la droite de tendance haussière active depuis le 15 mars risque de provoquer une deuxième vague de baisse surtout depuis que le RSI vient de valider un signal de vente.


Courbe des taux US

La courbe des taux US (différence entre les taux 10 ans et 3 mois-en vert sur le graphique) est inversée depuis l'été 2006.

Elle approche maintenant de niveaux ou le marché des actions (SP500-courbe rouge sur le graphique) s'est fortement retourné durant l'année 2000.

vendredi, mars 16, 2007

Technical Weekly 16032007

Equities
Markets have remained extremely volatile since last week and this should continue.
Investors will likely remain nervous in the near term.
Many of near-term price momentum oscillators are at levels comparable to other significant lows of the past few years. However, without confirming pessimistic extremes from sentiment measures, I believe there is still downside price risk.
That oversold condition is, in my view, the big question mark.
It makes any potential ounce likely to be a strong one, but we can get and stay oversold for long periods of time. If this is such a case, then being oversold actually has bearish implications.
Moreover, a break below important support level could trigger another wave of panic selling, in which case the next significant technical supports would be around 3470 for the DJ Euro Stoxx 50 (June 2006 low).( chart 1-DJ Euro Stoxx 50-weekly)


Equities should thus undergo more stress but technically speaking in terms of risk/return this is a poor time to consider reducing equity exposure, because most indices are now close to major supports on a long term basis.
This means that the bull market that started in 2003 is still intact.
Rather, investors should be watching closely supports levels (3900 on the DJ Euro Stoxx 50) and buying some stocks if the double bottom is validated and sell some stocks if the support is broken.(chart 2-DJ Euro Stoxx 50-Hourly).


Bonds
Technically speaking the 3.9% level is an important support zone.
This level is close to be broken and this could trigger another downside move towards the 3.7- 3.65% zone.


Brent
No change, after having broken up the medium term downtrend, the Brent faces another resistance line around the 62$.
Daily indicators seems to be rolling over which could means that :
- a break throught this level will not occur (at least in the near term).
- a re-test of the lows seen in January may follow.


Euro
Last week I said that as long as the Euro remains above support zone, the outlook would remain higher towards 1.326 short-term and 1.377 mid-term.
Now, the rate is breaking over resistance and since the volatility is very low, a (strong) upside move is likely.


mercredi, mars 14, 2007

Contrarian short term buy?

Put/Call ratio came out at 0.98, its highest level since October 06.
This level finds its place in the TOP100 of the highest Put/Call ratios.
Investors massively increased protection yesterday.

Head and Shoulders

In attachment a nice collection of fresh head & shoulders formations.
okay, the right hand shoulders are small in comparison with the left hand shoulders, but they are equal in heighth in most cases; so for me, these are valid tech formations, with the exception of the financials,(chart 3) they haven't broken their necklines (yet?).
But the fact that an overwhelming majority of analysts still sees the recent decline as a healthy, or a 'typical' bull market correction (what a difference with the other corrections in 2004 and 2006) makes me pay attention to the downside.
AEX (chart1 and 2): crucial support at 470/460; (470 = neckline HS & 460 = LT support line tested 4 times) falling below 460 means next target 410.


Karel Debie-Technical Analyst.

End of the rallye?

After the drop two weeks ago, we saw a very small recovery on the stock markets.
As the correction of May-June 2006, we see now a 2nd leg down (for the Fibonacci-lovers: the first decline stopped at the 38.2% retracement level of the previous rise).
This could bring us back very quickly towards the 3900 support level.

mardi, mars 13, 2007

Fin du rally?


Attention de nouveaux flux vendeurs commencent à se manifester à proximité du retracement des 50%.(voir graphique)
Le rebond semble donc se terminer
Il y a donc un risque important de rechute et d’une seconde vague de correction.

Performances best idea lists brokerages

Selon les statistiques publiées par "Barron's" les performances des meilleures idées en actions des différents "brokers&banques d'affaires US au cours des dernières années sont loin d'être brillantes.

Moyennes mobiles DJ Euro Stoxx 50

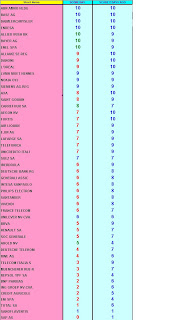
En se basant sur plusieurs moyennes mobiles (20, 50, 100 et 200) je consate que la tendance reste bonne pour la plupart des valeurs du DJ Euro Stoxx 50 même si la plupart des scores (de 0 à 10) sont à la baisse (en rouge).

lundi, mars 12, 2007

Corrections in US markets since 1982

Please find below a table published by Goldman Sachs, which analyzed corrections (move of -5% in defined bull markets) since 1982. As you can easily read, corrections last 2.1 months on average. The current correction only lasted 5 days. Too short? Only future will tell. However, we must not expect a very rapid rebound as the correction damaged investors' confidence.

vendredi, mars 09, 2007

GBL BAYER

GBL has clearly underperformed the market over the last few months but is a long- term outperformer.
If you look at the relative chart (black line), you can see a breakout above a downtrend resistance line in the beginning of March;
meaning that the stock is recently showing strenght versus the market.


Bayer recently rebounds on the confluence of 2 supports zones (red and black line).This bounce is a buying opportunity because: 1 the stock was oversold
2 the Macd is close to give a buy signal and 3 the long term pattern is still bullish, showing higher highs and higher lows.


Technical Weekly 09/03/2007

Equities
European and US equity markets prices trade now under the 50 day moving average for the first time since July of last year.
That plunge inflicted a lot of other technical damage too, like a clear break under an important intermediate support.
It is worth noting that many of these markets had been rallying themselves since June 2006 and were exhibiting signs of being overbought.
So a correction was expected but the problem arises when you fall more than 7% in week time. Not only is that far from being a gentle rolling downtrend, it also negates any decent use of your technical indicators : they all look bearish by that point!
This is the first time in months anybody had to deal with real bearishness.
Despite the market’s rebound this week, it would be very unusual to reverse such a sharp drop without a period of basing and back-filling, so investors should remain alert to the possibility of lower prices.
Nevertheless, in spite of the short-term damage done to the price charts over the past week, I think it is too early to be excessively bearish because the longer-term price pattern is still bullish (higher highs and higher lows) and the 200 day moving average is still rising.(magenta line on the weekly chart of the DJ Euro Stoxx 50).
Conclusion : because there is no evidence that a sustainable low has been reached, the recent stock market drop may have longer to run.However, the odds appear to favor a near-term rebound rather than a deeper plunge.


Bonds
Yields dropped to early year levels this week as the plunge in equity markets set off concerns investors will shy away from riskier assets.
Technically speaking the 3.9% level is an important support zone.
A break below this level could trigger another downside move towards the 3.65% zone.


Brent
After having broken up the medium term downtrend, the Brent faces another resistance line around the 62$.
Short terms indicators are now overbought.


Euro
The failure to break above 1.326 indicates a consolidation.
But as long as the Euro remains above support zone, the outlook would remain higher towards 1.326 short-term and 1.377 mid-term.


mardi, mars 06, 2007

SP 500

Who after one week is already looking for some bargains, is better of with trading than with investing. Could be interesting to take note of the following.


Altough, some stocks of course will have found their bottom today or yesterday.
And all this taking into account that this is the 6th (!) "buy on the dip."

Dirk Boodts(Technical analyst)

lundi, mars 05, 2007

Good news?

March 5 (Bloomberg) -- The biggest money managers and strategists on Wall Street are standing their ground.
They say the four-year bull market in U.S. stocks will persist even after the Standard & Poor's 500 Index plunged the
most since January 2003 last week on concern a slowing economy will hurt corporate profits.
When I look the at the chart below comparing the SP 500 since 2003 with the strategists recommended US stocks allocation in % (yellow line), I have some doubt about this bullish call.

Test sur le support

Les marchés Européens vont bientôt tester les supports long terme.
Sur le graphique hebdomadaire ci- joint on observe que la tendance principale est toujours haussière mais cette correction technique est violente et a déjà concentrée beaucoup de volumes.
Il s’agit en conséquence d’un signe d’alerte important mais le test décisif aura lieu lorsque l'indice testera la confluence de la zone de support des 3900 ainsi que la moyenne mobile à 40 semaines (200 jours-en mauve).

vendredi, mars 02, 2007

JPY/EUR - T.A. - Goodbye Mr Carrytrade?

No need to explain what the famous JPY-carry trade means...
As the graph in attachment shows, odds are turning towards... the end of the carry trade!!!
The JPY is breaking out of its 2006-downtrend (vs EUR), combined with a positive divergence on RSI/MACD. Further upside is likely.
It looks like hedgefunds are changing their strategy towards the JPY-free-lunch-strategy, and are obliged to cover their JPY-loans (buying JPY).
This could hurt the stockmarkets some more in the near future...

Stephan Debruyne.

Cash-Analyse technique

Ne manquez pas l'article sur l'analyse technique dans le cash de cette semaine.

jeudi, mars 01, 2007

Nombreux signaux de ventes

Comme le montre le tableau, la tendance est clairement baissière sur l'Euro Stoxx 50.La quasi majorité des indicateurs journaliers étant dans le rouge.Il est également à noter que la plupart des valeurs ne sont pas pas encore survendues.