vendredi, janvier 26, 2007

Be careful on bonds?

The chart of the 10 year US yield shows that price made new low in December 06 on rising Macd.
This divergence finally gave the signal that a bottom had been reached.
It is interesting to note that this bottom pattern can be classified as an imperfect double bottom.
When the long term down-trendline was broken in the beginning of January, the buy signal was given.
The objective in the coming weeks according to the swing rule is above the 5% level.


The German Government bond yield also validates a double bottom pattern.The recent pull-back was succesful and the rally could now extend towards the 4.4% zone.
So, it seems that long term yields finally broke to the upside (reversal patterns) and establish a strong upward trend.

DJ Euro Stoxx 50

L'indice DJ Euro STOXX 50 ne parvient pas à dépasser la résistance vers les 4200.

Sur le graphique horaire ont peut clairement constater que ce dernier reste borné depuis 1 mois entre 4120 et 4200.
Il faut donc éviter de tirer des conclusions trop tranchées et attendre une sortie du "trading range".


jeudi, janvier 25, 2007

Contrarian signal?

Many thanks to Arthur Hill for this interesting links about barron's :
http://online.barrons.com/public/article/SB116959542334385566-qgJzKPQqzwJs5js0lSKJtqwVSV8_20080125.html?mod=9_0002_b_online_exclusives_weekday_r1

The uptrend must be about to end if Michael Kahn is writing something bullish! What's more, he even acknowledges this at the end of his article. Kudos to Kahn

mercredi, janvier 24, 2007

Uranium

De nombreux hedges funds sont très positifs sur le prix de l'uranium.
Une bonne façon de jouer cette idée est d'acheter le holding Uranium Participation sur la bourse canadienne.
Le titre vient juste de sortir à la hausse d'un triangle symétrique et l'indicateur Macd valide ce signal d'achat.
L'objectif de cours se situe au-dessus des 15$can

Beaware of the correction part 2-The bullish camp

Some bullish reactions from members of the Belgium Association of technical Analysts:

My own graphs... With confirmation than the RSI simply said that we are in an "oversold" situation.
Not more, no signal to sell nor to buy puts.

Jacques DEFRANCE

I am also bullish for the long term. A short term correction is of course always possible but it would be mild because the US stockmarket is close to the equilibrium right now.
The term "Stress" is used in terms of financial instability, as defined by F. Mishkin. For further explanation about this graph, go to my new blog : http://profitip.blogspot.com/2007/01/new-stabilization-tool-for-stock-market.html

Bernard Leclere

These charts also show negative divergences since November and these divergences just show less upside momentum, which is not bearish. There is no downside momentum to speak of yet. I imagine that the Dow will break support from the late Nov-early Dec lows when RSI moves below 45. This would constitute a medium trend reversal and I would then expect a retracement of the advance that began in July . The trend is in place until proven otherwise. An oldee, but a goodee!

Arthur Hill


Sur l'Eurostoxx 50, la zone de soutien comprise entre 4072 et 4123points continue de jouer son rôle. Hier, les flux baissiers ont de nouveauété contrés et ont conduit la séance vers un chandelier en quasi-doji.Les prises de bénéfices ne parviennent donc pas à dominer très longtemps et l'indice européen semble désormais en bonne posture pour revenir attaquer activement la résistance à 4195 points au cours des prochaines séances.

Jean-Christophe Dourret-Analyste technique.

mardi, janvier 23, 2007

Be aware of the correction

Voici un intéressant commentaire sur l'indice Stoxx 600 fait par un des membres de l'association belge des analystes techniques, à savoir M. Stephan Debruyne.

Once again, we're facing a nice divergence between the Stoxx600 and RSI/MACD.
Looks like the same divergence we had in May 2006...time to reduce some stocks!


Nasdaq Composite

Il semble bien que la récente percée à la hausse sur le Nasdaq soit déja terminée.
Pire, l’indice vient de valider une cloture en-dessous d’une droite de tendance haussière qui prévalait depuis juillet 06.
A noter (flêches) le très bon timing de l’indicateur TD Combo sur les plus bas et les plus hauts de l’indice.
L’indice demeure assez volatil et il existe un support au alentour de la zone des 2395-2390 mais le momentum reste négatif et les résultats d’Alcatel-Lucent ne vont évidemment pas arranger les choses.
Prudence donc sur les technos.

lundi, janvier 22, 2007

Résultats de sociétés US

Les résultats du quatrième trimestre aux USA sont-ils moins bons que prévu ?
Ce qui est surprenant c’est la forte chute des surprises positives de 65% à 52%(courbe noire) et la forte hausse des déceptions de 20 à 28%. (courbe rouge)
A suivre donc car seulement 1 /4 des sociétés ont pour l'instant publié leurs résultats.

Technical Weekly 22012007

The market closed the week on an upnote.
The overall trend remains positive but the Dj Euro Stoxx 50 is now close to support.( see arrow on chart 1)
Momentum measuring by technical indicators are still bearish which means that the correction could go deeper.
In my view, this correction is likely here early in 2007, which should set up a better buying opportunity within an ongoing bull market.
The dispersion of returns for stocks is increasing, reflecting more volatility.
I believe the odds of further near-term choppiness remain high.


Oil continues to fall after US stockpiles surged and the international Energy Agency lowered its forecast for global demand because of warmer weather.
The next significant support for the brent is located around 47$, which correspond to a 50% retracement of the 2001-2006 uptrend.
The brent is now deeply oversold and I think that at least a consolidation and quite possiblly an oversold bounce could occur in the coming days.


The Euro-dollar is testing support around 1.29, I will monitoring closely this level in the coming days because we think the euro could rebound from here.


Yields continue to trade around the 4% level, the trend remains positive but most short term indicators are close to looking bearish.

lundi, janvier 15, 2007

Ranking secteurs Stoxx

Les secteurs à sur-pondérer sont en vert, ceux à sous-pondérer en rouge.


A suivre particulièrement, le secteur des média qui monte de la 17ieme à la 11ième place.
La courbe en rouge est le secteur des média en absolu, celle en noir représente le ratio du secteur par rapport au Stoxx600.


signaux d'achats&ventes


Technical Weekly 15012007

Usually, I show you a chart of bond yields but this time I decide to show the monthly long term chart of the German government bond futures contract since the beginning of the nineties.
As you can see the price reaches a key chart point (circle) which is an uptrend line that has been in place for 13 years.
This should be a good place to buy bonds as the risk/reward looks attractive.
Howevere, If you look at momentum indicators you see another story.
Take the Macd for instance, this indicator is already negative on all time frames (daily, weekly and monthly) and if you consider that momentum leads price, a breakdown of this very important support line could occur soon.Strangely, the recent drop of commodities is not supporting for bonds.


Another important event last week was the fall of the Euro as M.Trichet higlighted risks to the outlook for growth.
Technically, the Euro-dollar is approaching support round 1.29.
This short-term pull-back is not enough for me to invalidate the recent breakout and renewed strenght may follow in the coming weeks.
On the other hand, a drop below 1.29 could invalidate this scenario.


Commodities started the year badly and most of them are technically very weak.
However, on a short-term basis they are now oversold.
As you can see on the chart, the Brent broken up the uptrend channel recently.
The next support is located around 47$, which correspond to the May 2005 low and to a 50% retracement of the 2001-2006 uptrend.


European equities continue to trade sideways, the chart of the DJ Euro Stoxx 50 shows that the long uptrend channel remains intact but I can not exclude a deeper correction towards the support zone (4080-4070).


Emerging markets are lagging and most of them are correcting since the beginning of the year.
U.S. stocks finished the week higher, as the Dow Jones Industrial Average closed at a record high.
The Nasdaq Composite added 17 points friday to hit a six-year high, and the S&P 500 Index tagged a five-year high.
All three of the US indices closed the week higher, with the Nasdaq leading the way with a gain of 2.8 percent.
The Nasdaq Composite broke the barrier of 2470, rallying all the way up to a close of 2502.82.
Chart 2 shows that the index is already into a bullish Macd crossover, that paired with the break of the past resistance is enough for me to make a bullish call here.
Investors may be waiting to see how the numbers stack up. If earnings remain strong, and the interest rate outlook doesn't get any worse, I think stocks may start to move back up.
I also observe wider swings and the volatility seems to be rising since we are now starting the earnings reporting season.

vendredi, janvier 05, 2007

Technical Weekly 05012007

Base metals and oil stocks dropped this week, as copper and oil prices fell strongly.
The first chart shows the price of copper breaking down from a descending triangle.
The recent move was quite steep but the down-trend is intact and as you can see the short term target (around 230) is not yet reached.
Copper is often used as a reliable economic indicator because of its widespread production.


Similarly, the big drop in oil prices in recent months is raising concerns.
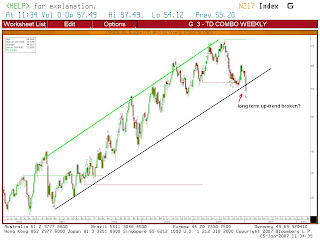
But technically speaking the Brent is another story, because it seems now that the long term up-trend (weekly chart) is ending.
A sell-off in commodities from copper to oil over the past few days could signal a slowdown in economic growth.
Yet, it seems that few investors have picked up on most of these (bearish technical) signals.


It is no surprise that the dollar is giving a boost from the falling commodities and the Euro-dollar is now retesting the recent breakout around the 1.29 level.
The last resistance is now becoming support and the Euro is still in the process of correcting its October/November rise.


Stocks have mixed performances as defensive sectors like Telecom and Health Care performed very well.
This sector rotation from commodities to defensives stocks needs to be monitoring closely because it could imply some important changes in portfolios in the coming weeks.
The table below shows a technical scoring from zero to ten points for all the Stoxx sectors based on different moving averages.
As conclusion, the trend remains very good for most of them but utilities, basic resources and oil&gas are deteriorating and heath care is strongly improving.


Finally, the German ten year Bund Yield is still trying to break above the level of 4% but short term indicators are overbought and some of them are already rolling over.


mardi, janvier 02, 2007

EURHUF

On the weekly chart, the Rate is approaching support around 248.
The trend remains bearish but the recent decline was quite steep and a buy signal could occur next week as the TD Combo is flashing a 12.
The last time we had a buy signal (see arrows) the trend reverse strongly in the coming weeks.


The consensus on Bloomberg leaves also few up-side potential for the HUF versus the EUR.
On the contrary because the median forecast for Q1 is 260.

TELECOM

The performance of the Telecom sector has improved dramatically over the last couple of months. Technically the picture has clearly turned more positive.
On the chart below you can see, the breakout in absolute (in red) and relative basis. (Black line)


The Telecom sector is ranked 2nd out of the 18 Stoxx sectors rankings. (Just below Financial Services).
It seems that the investment community is finally warming up to the positives this sector has to offer: strong (free) cash flow generation cleaned up balance sheets and a high dividend yield.

TELENET: The upward trend for TNET remains intact but after a strong rise, the stock is correcting from an overbought level.Buy the dips.