Technical Weekly 12062006
EQUITIES
The Euro Stoxx 50 continues to decline and trades now below the 200 day moving average.
Last week the index has completed a bearish “pennant” continuation pattern, which means that a deeper correction is expected in the coming weeks.
The fact that the index has not (yet) been able to initiate a significant technical bounce is a cause of concern.
But, due to significantly oversold daily conditions, there may be a technical bounce in the near term.
However, I do not believe that such relief rallies are likely to be sustained.
The chart below shows the DJ Euro Stoxx 50 with three momentums indicators (Macd).
The daily one is very oversold but gives no buy signal yet.
The weekly (mid-panel) is bearish and continues to fall.
The monthly one, which is the more important is still rising but weakening.
Technically speaking traders have no more the “buy the dip” mentality and will now surely “sell the rally”.This behaviour can be seen in the next chart as the commercials (“smart money”) are now extremely short while “small traders”(yellow line) have increased the size of long positions. 

COMMODITIES
Brent
The brent continues to consolidate around 70$ giving no clear short-term signal.
The long-term trend is still positive but a break below 67$ would change this view. 
Gold
Is now close to support around 600$.
This psychological level could attract buyers but the most important support level is located in the 550$ zone.
GERMAN 10 YEAR YIELD
The German 10 year yield is challenging an important up trend-line.
If this support doesn’t hold we have here a high probability of a change of scenario.The weekly momentum is also close to give a sell signal, which means that a test of the 3.8% in the coming weeks seems likely. 
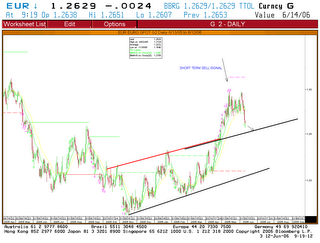
EURO-DOLLAR
The short-term correction continues and may extend towards the first support zone. (see arrow on chart)
But as long as support around 1.23 holds, the outlook would remain higher towards a test of 1.30, which is a strong resistance.
A move back below 1.23 would negate this bullish view, and suggest a test of the long- term support line, which currently lies at 1.2100. 


Aucun commentaire:
Enregistrer un commentaire