Technical Weekly 22052006
EQUITIES
After the “sell off” of last week, equities markets are now oversold.
However, the longer-range chart picture has weakened, with most weekly indicators on sell signals.
The daily chart below shows the Euro-Stoxx 50 and the 9-day RSI line below 30 for the first time this year.
In addition, the index has reached its 200-day moving average and potential chart support. (in yellow)
That may be enough to cause a market rebound this week.
However, while short-term indicators are oversold, weekly and monthly indicators are not.
Since weekly and monthly indicators are more important than daily ones, technically speaking I would continue to view any short-term rally as another selling opportunity. 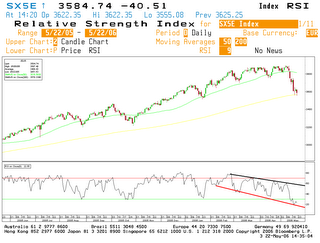
COMMODITIES
Brent
Validates a short-term bearish pattern reversal pattern last week.
The next key support is located around 63$.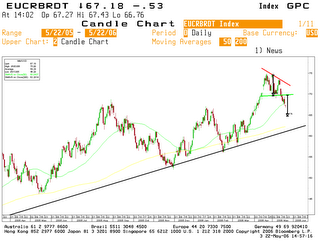
Gold
The trend of gold is in a short-term decline (matching the bonds recovery).
Because the selling pressure is not over yet, I advice not to buy before a successful test of the rising channel.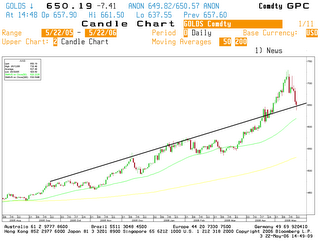
GERMAN 10 YEAR YIELD
The short-term technical picture changed to neutral.
The short-term Macd indicator is falling and should support the slowly improving short-term outlook for bonds.
A break of the rising trend-line (see arrow on the chart below) is needed to change my view and to be short term bullish.
However on a long-term basis the downtrend still trend prevails for bonds.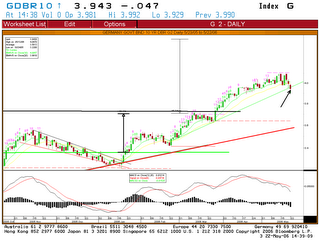
EURO-DOLLAR
The short-term fight to quality could well force the US dollar higher even against the EURO, but the long-term trends remain bearish for the $.
The daily chart below shows the rate in correction mode with a probable retest of the 1.25 level in the coming weeks.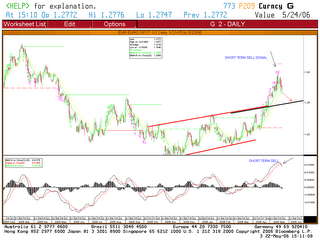


Aucun commentaire:
Enregistrer un commentaire