mardi, novembre 28, 2006
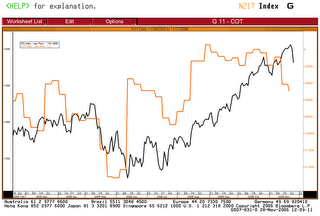
Traders Commitment
Les "gros joueurs" (commercials-courbe rouge) continuent de parier sur une baisse des marchés.
Publié par
HEIREBAUDT FREDERIC
à
12:14 PM
0
commentaires
![]()
Libellés : SENTIMENT
lundi, novembre 27, 2006
Financières Européenes
Les financières Européennes commencent à souffrir à cause de la courbe des taux.
Publié par
HEIREBAUDT FREDERIC
à
4:52 PM
0
commentaires
![]()
Libellés : SIGNAUX
vendredi, novembre 24, 2006
Technical Weekly 24112006
Equities
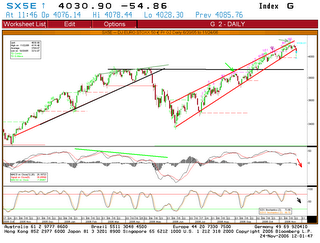
Last week I said a correction could start soon and that the DJ Euro Stoxx 50 could be break down from a large rising wedge.
Unfortunately that is what is happening now.
The rising wedge is a bearish pattern that begins wide at the bottom and contracts as prices move higher and the trading range narrows.
The correction that follows is often steep and quick in time.
The first support on the index is located around 3990-4000 and a more important one around 3880.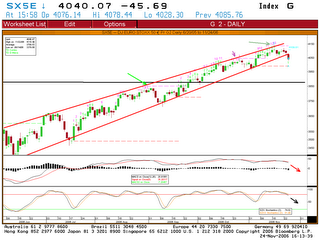
Brent
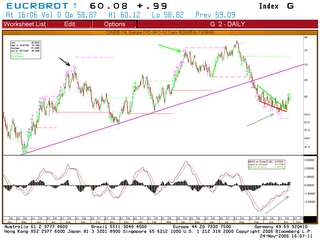
The rebound we anticipate last week is coming.
After the confirmation of the falling wedge a few days ago, I anticipate now a strong rebound, maybe towards the 70$ level.
Trades above 630$ and is forming a big “W” bullish pattern.
If gold is able to continue rising in the coming days it will reintegrates the bullish long- term channel.
As you can see on the chart this could lead to much higher prices in the coming months.

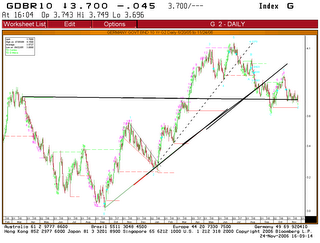
Yields seem to stabilize around the 3.7% level, but a deeper correction in the stock market could trigger a “flight to quality” and a rally for bonds.
On a long term basis the overall trend remains negative on bond yields.
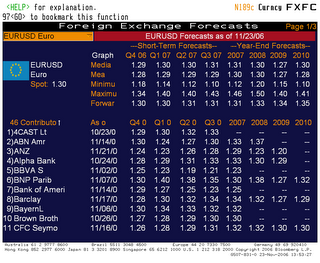
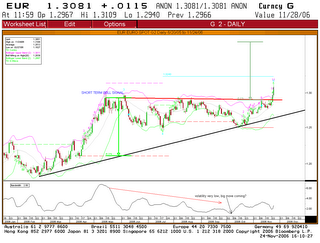
Over the last few weeks, I regularly highlighted that the euro-dollar was challenging a key resistance zone.
The breakout through the 1.3 level is an important technical buy signal because it have trigger significant stop losses from traders that were bullish for the $.
This could lead to a significant acceleration upward towards 1.37-1.38 in the short- term. period.
Publié par
HEIREBAUDT FREDERIC
à
4:29 PM
0
commentaires
![]()
Libellés : TECHNICAL WEEKLY
DJ Euro Stoxx 50
L'indice vient de valider une sortie baissière en forme de biseau ascendant étendu.
Publié par
HEIREBAUDT FREDERIC
à
11:51 AM
0
commentaires
![]()
Libellés : INDICES
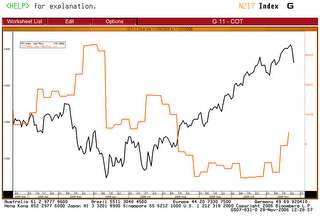
EURO DOLLAR-DJ Euro Stoxx 50
La dernière correction sur les marchés (mai-juin) a été précédée d'une forte hausse sur l'Euro-dollar (en noir sur le graph.) qui a progressé de 1.186 à 1.295 en 3 mois de temps.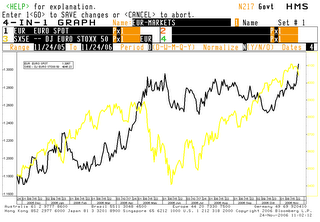
Publié par
HEIREBAUDT FREDERIC
à
10:58 AM
0
commentaires
![]()
Libellés : DEVISES
jeudi, novembre 23, 2006
EUR
Il semble bien que l'Euro-dollar soit parvenu à sortir de sa zone de congestion en forme de triangle ascendant.
Publié par
HEIREBAUDT FREDERIC
à
1:47 PM
0
commentaires
![]()
Libellés : DEVISES
vendredi, novembre 17, 2006
Technical Weekly 17112006
After the break of the 3880-3890 resistance level in October, the DJ Euro Stoxx 50 is testing the next level around 4100.( a 138.2% retracement of the May-June sell off.)
What is worrying is the negative divergence we are building for the moment between the index and its technical indicators: MACD and RSI are already showing hesitation (lower highs). This pattern is in fact the same one we saw in May 2006.
Moreover the index seems to be forming a large rising wedge bearish pattern and the TD Combo indicator is now flashing sell signals on different time frames.(arrows)

Brent
No change, after a steep decline, the Brent is approaching his long-term support channel (weekly chart, not showed here), I believe it could rebound from oversold condition.Recently the TD Combo indicator gave a buy signal and as you can see on the chart, each signal (pink 13-arrows) was followed by a strong move.


This week I also take a look at copper (generic future) because it recently broken down from a descending triangle bearish pattern.

No change, yields continue to be volatile and extremely difficult to trade.

The 1.29 resistance zone was too strong for the rate, but the bullish ascending triangle is still in place.
A breakout above the 1.29 level would trigger another acceleration.

Publié par
HEIREBAUDT FREDERIC
à
3:44 PM
0
commentaires
![]()
Libellés : TECHNICAL WEEKLY
jeudi, novembre 16, 2006
Signaux d'achats&ventes
Voici les derniers signaux d'achats&ventes sur les bandes de bollinger pour les valeurs du DJ Euro Stoxx 50.
Publié par
HEIREBAUDT FREDERIC
à
3:35 PM
0
commentaires
![]()
Libellés : SIGNAUX
DJ Euro Stoxx 50
L'indicateur TD Combo donne un signal de vente sur le DJ Euro Stoxx 50 sur le graphique horaire et journalier (chiffres 13 et flêches sur le graphique).
Publié par
HEIREBAUDT FREDERIC
à
3:15 PM
0
commentaires
![]()
Libellés : INDICES
Conférences
Voici 2 conférences intéressantes pour 2007 :http://www.salonat.com/et http://www.ta-conferences.com/taeurope2007.htm
Publié par
HEIREBAUDT FREDERIC
à
3:12 PM
0
commentaires
![]()
Libellés : LIENS/ARTICLES
mercredi, novembre 15, 2006
Bulkowski's chart pattern
Pour ceux qui s'intéressent au chartisme et aux différentes figures techniques voici un lien intéressant :http://mysite.verizon.net/resppzq7/index.html
Publié par
HEIREBAUDT FREDERIC
à
4:53 PM
0
commentaires
![]()
Libellés : LIENS/ARTICLES
lundi, novembre 13, 2006
Devises
Au niveau des devises la tendance pour l’EUR est très disparate.
Le tableau ci-dessous est un score technique compris entre 0 et 10 points basé sur plusieurs moyennes mobiles.

En ce qui concerne l’EURHUF il faut toutefois relativiser cette tendance positive car le taux se situe sur un soutien important vers les 260 sur le graphique journalier.Il en va de même pour l’EURGBP où le support long terme se trouve vers les 0.665.(ligne rouge)


Publié par
HEIREBAUDT FREDERIC
à
10:11 AM
0
commentaires
![]()
Libellés : DEVISES
vendredi, novembre 10, 2006
TECHNICAL WEEKLY 10112006
Equities
The DJ Euro Stoxx 50 has now reached my target around 4070-4100, which was a 138.2% retracement of the May-June sell off.
Indicators are now overbought on all time frames and the daily ones (see RSI on the chart below) are diverging from price and already falling.
A correction could occur soon, but as you can see on the chart below the trend is still up and such a decline could provide another buying opportunity.
Brent
As the Brent is approaching his long-term support channel (weekly chart, not showed here), I believe it could rebound from oversold condition.
Gold
Is trying to break above resistance around 630$.
A break above this level would be technically very positive because:
1)the recent “sell off” could be a bear trap. 2)The next target is the uptrend-line of the rising channel, which implies a huge gain in the coming months for gold.

Yields continue to be volatile and extremely difficult to trade.

I'm watching closely the rate, because the big move I anticipated is developing.
Publié par
HEIREBAUDT FREDERIC
à
2:58 PM
0
commentaires
![]()
Libellés : TECHNICAL WEEKLY
mercredi, novembre 08, 2006
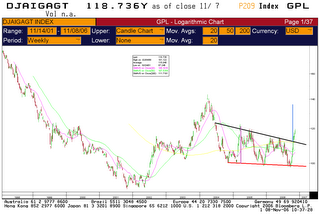
DJAIG AGRICULTURE
L'indice des matières premières agricoles dispose encore d'un bon potentiel de hausse à moyen terme.
Publié par
HEIREBAUDT FREDERIC
à
10:25 AM
0
commentaires
![]()
Libellés : MATIERES PREMIERES
mardi, novembre 07, 2006
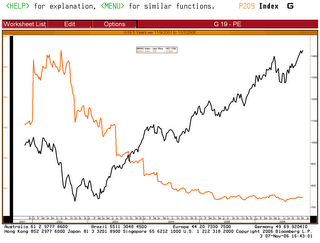
MSCI World et son P/E
L'indice MSCI World teste les plus hauts atteint en avril 2000.
Publié par
HEIREBAUDT FREDERIC
à
4:43 PM
0
commentaires
![]()
Libellés : INDICES


