TECHNICAL WEEKLY 10112006
Equities
The DJ Euro Stoxx 50 has now reached my target around 4070-4100, which was a 138.2% retracement of the May-June sell off.
Indicators are now overbought on all time frames and the daily ones (see RSI on the chart below) are diverging from price and already falling.
A correction could occur soon, but as you can see on the chart below the trend is still up and such a decline could provide another buying opportunity.
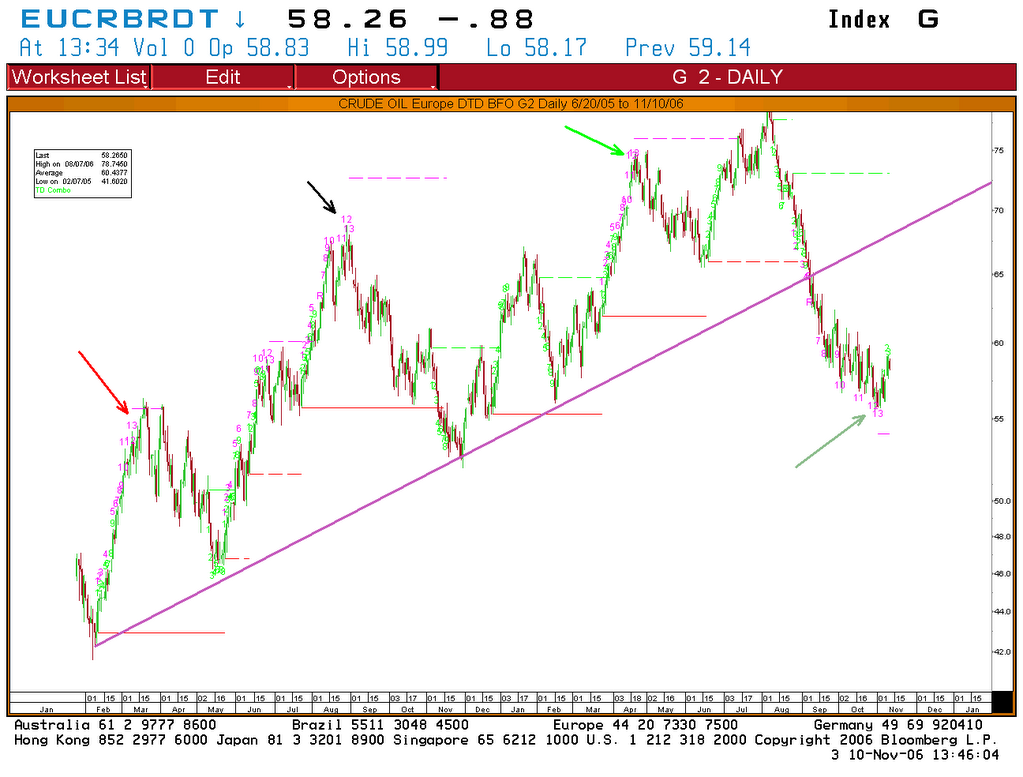
Brent
As the Brent is approaching his long-term support channel (weekly chart, not showed here), I believe it could rebound from oversold condition.
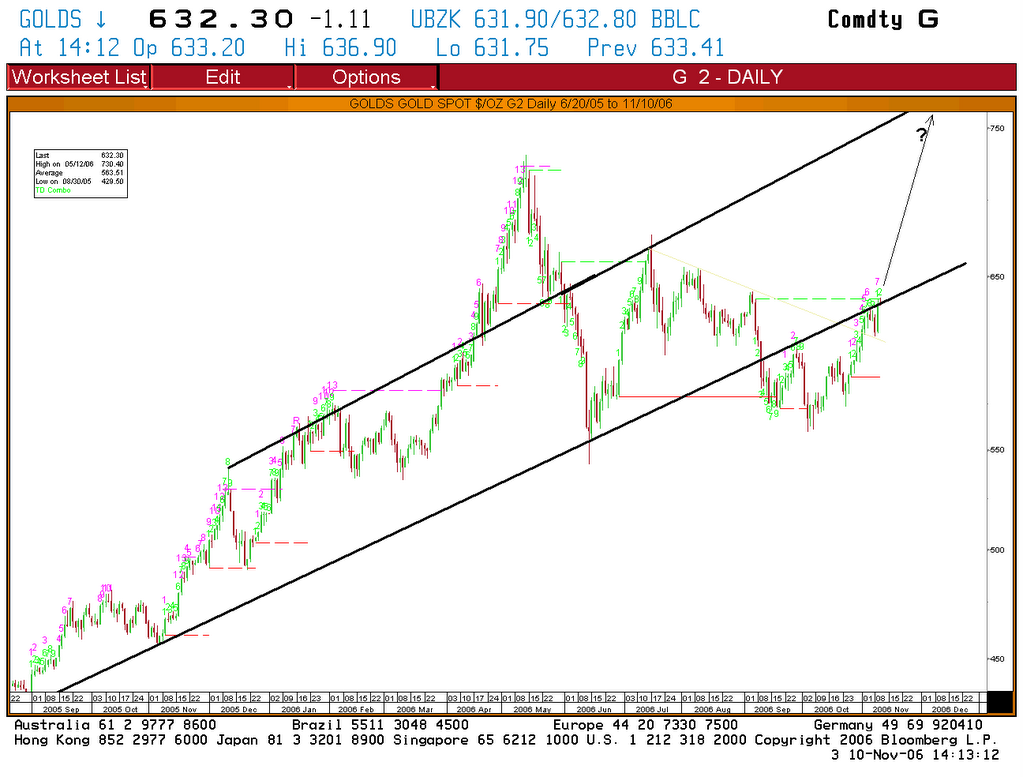
Gold
Is trying to break above resistance around 630$.
A break above this level would be technically very positive because:
1)the recent “sell off” could be a bear trap. 2)The next target is the uptrend-line of the rising channel, which implies a huge gain in the coming months for gold.
Yields continue to be volatile and extremely difficult to trade.
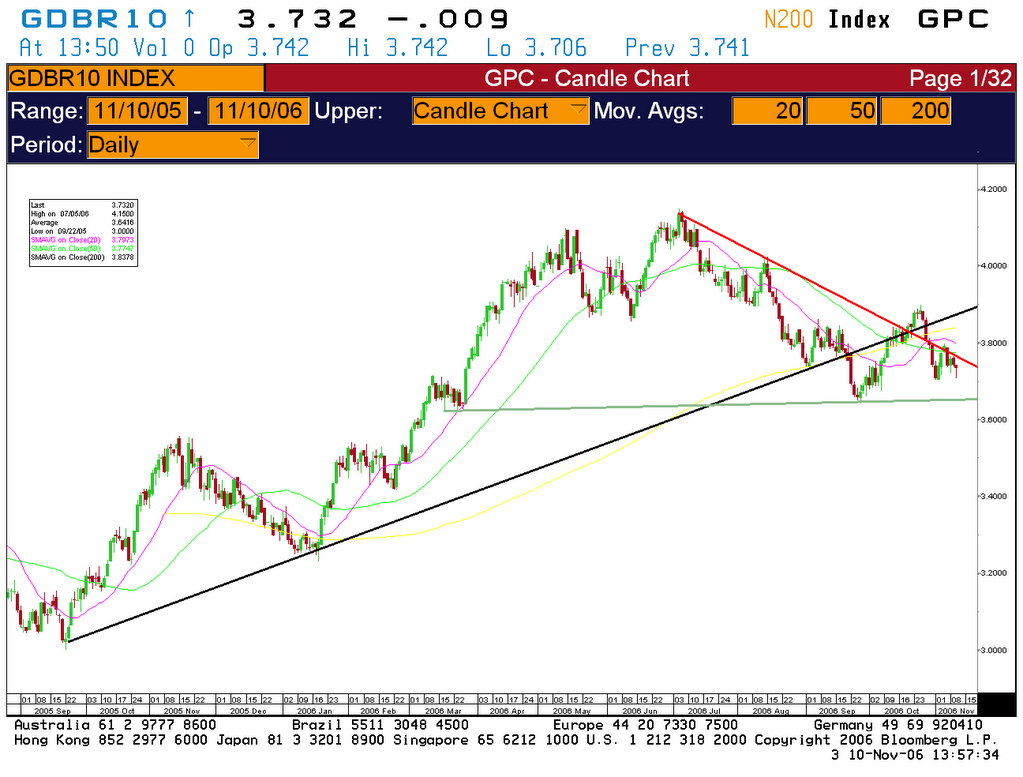
I'm watching closely the rate, because the big move I anticipated is developing.


Aucun commentaire:
Enregistrer un commentaire