Technical Weekly 17112006
Equities
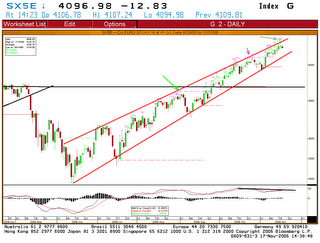
After the break of the 3880-3890 resistance level in October, the DJ Euro Stoxx 50 is testing the next level around 4100.( a 138.2% retracement of the May-June sell off.)
What is worrying is the negative divergence we are building for the moment between the index and its technical indicators: MACD and RSI are already showing hesitation (lower highs). This pattern is in fact the same one we saw in May 2006.
Moreover the index seems to be forming a large rising wedge bearish pattern and the TD Combo indicator is now flashing sell signals on different time frames.(arrows)
For conclusion, I can say that the trend is still good and as long as the uptrend line (in red on the chart) is not broken, there is no need to panic but a correction could start soon.

Commodities
Brent
No change, after a steep decline, the Brent is approaching his long-term support channel (weekly chart, not showed here), I believe it could rebound from oversold condition.Recently the TD Combo indicator gave a buy signal and as you can see on the chart, each signal (pink 13-arrows) was followed by a strong move.

Gold
Was not able to break above the 630$ resistance zone, gold could be forming a triangle pattern with a support level around 570$.

Copper
This week I also take a look at copper (generic future) because it recently broken down from a descending triangle bearish pattern.
This week I also take a look at copper (generic future) because it recently broken down from a descending triangle bearish pattern.
I think this event is one important one because copper is often seen as a relevant economic indicator.

German 10 Year Yield
No change, yields continue to be volatile and extremely difficult to trade.
No change, yields continue to be volatile and extremely difficult to trade.
The breakout above 3.8 was a bull trap and yields could now trade sideways in the coming days/weeks.

Euro-dollar
The 1.29 resistance zone was too strong for the rate, but the bullish ascending triangle is still in place.
A breakout above the 1.29 level would trigger another acceleration.
The 1.29 resistance zone was too strong for the rate, but the bullish ascending triangle is still in place.
A breakout above the 1.29 level would trigger another acceleration.
Support is located around 1.27-1.265(rising black line).


Aucun commentaire:
Enregistrer un commentaire