Elliott waves bear market potential target

"click on the chart to enlarge"
According to the Elliott waves theory the bull market active since end 2002 ended in October 2007.(wave 5)
The chart below of the SP 500 shows that the decline into January was a nice "A" wave.
This was the first leg of the correction.
What we saw from January through May was the "B" wave higher, which essentially corrected the first correction.
As you can see the impulse waves, (decline from October) unfolded in five wave and the rally through May was arguably three waves.
That leaves us with the current decline now just getting underway.
The "C" wave is usually as long as A, but may often be 1.62 x A.
So the downside target of this bear market for the SP 500 could be between 1130 and 1075.
This last number corresponds to the bottom of the wave 4 of the last bull market.(horizontal line on the long term chart above)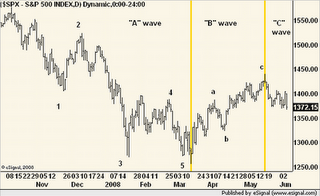


A & C are (mostly) 5-waves


4 commentaires:
that doesn't happen everyday. wish you all the best.
What a great moment of reading blogs.
Katon, Goukakyu no jutsu.
Considering the fact that it could be more accurate in giving informations.
Enregistrer un commentaire