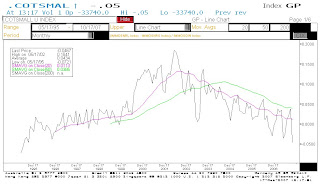
Trading portfolio
Here is an update of my trading portfolio :
10 stocks only big caps or trackers, no cash, no intraday transactions (only close), fees 0.35%.
High turnover and long only.

Etudes de l'évolution de marchés financiers, (actions, obligations, indices, devises...) principalement sur base de graphiques, dans le but de prévoir les futures tendances.
Here is an update of my trading portfolio :
10 stocks only big caps or trackers, no cash, no intraday transactions (only close), fees 0.35%.
High turnover and long only.

Publié par
HEIREBAUDT FREDERIC
à
11:37 AM
0
commentaires
![]()
Libellés : SIGNAUX
Equities
After a typical short term-pullback, equity markets rebound strongly on support zone.(arrow on the chart of the DJ Euro Stoxx 50)


Publié par
HEIREBAUDT FREDERIC
à
2:54 PM
0
commentaires
![]()
Libellés : TECHNICAL WEEKLY
 Last week the US market produced a "Hindenburg Omen" (HO), which could be an early warning signal of a bigger correction.
The Hindenburg Omen is a technical analysis signal that attempts to predict a forthcoming stock market crash.More infos :http://en.wikipedia.org/wiki/Hindenburg_Omen
Publié par
HEIREBAUDT FREDERIC
à
4:48 PM
0
commentaires
![]()
Libellés : SENTIMENT
Technical scoring for the Stoxx sectors based on different moving averages.
Publié par
HEIREBAUDT FREDERIC
à
3:18 PM
0
commentaires
![]()
Libellés : SIGNAUX
The Dj Euro Stoxx 50 is testing support today (lower range of uptrend channel) around 4330.
A critical moment to see whether we stay in our August-uptrend or we could drop below and face some difficult days/weeks.
The coming days will give us an indication of what it is necessary to do.
Publié par
HEIREBAUDT FREDERIC
à
2:18 PM
0
commentaires
![]()
Libellés : INDICES
Equities
In the long-term , the general technical environment is in degradation but we do not observe sell signals validated on this horizon.
On a mid-term basis, a bull consensus (from an inverse head and shoulder pattern) is still in place.
This technical rebound aims at bringing back the indices to the height of their preceding high points.
During this movement of recovery, profit-takings occur and we need to monitor carefully the support zone.(arrow)
Daily technical indicators are already bearish so that the odds favor more downside in the coming days.
All this can be seen on the chart of the DJ Euro Stoxx 50 below. 


Publié par
HEIREBAUDT FREDERIC
à
11:05 AM
0
commentaires
![]()
Libellés : TECHNICAL WEEKLY
If history is of any guide we can wait another 16 months.
Lots of reason to draw a comparison between the TMT bubble and the emerging market one. Post LTCM the easing of monetary policy has fuelled the TMT bubble and attracted easy money on th basis that the internet revolution was a growth theme, immune to the economic backdrop. Today the conventionnal wisdom is assuming that emerging markets can weather any softness in the US and the rest of the world…. Still unproven.
"click on the chart to enlarge"
Publié par
HEIREBAUDT FREDERIC
à
4:29 PM
0
commentaires
![]()
Libellés : INDICES
The US small traders (dumb money) seem to be expecting some kind of crash again.
In the S&P 500 futures and options, they now have a larger net short position as a percentage of the open interest than at any time since 1995.
May be good news for the end year rally!
Publié par
HEIREBAUDT FREDERIC
à
1:25 PM
0
commentaires
![]()
Libellés : SENTIMENT
The chart below shows some sectors and trends in realtive versus the Stoxx index. (this a great tool for spoting trends rotations!)
As you can see since 2002 emerging markets (mxef) and basic resources stocks (sxpp) strongly outperformed (bubble?).
Construction (sxop) and small caps (scxe) are looking toppish and real estate is still falling (epra).
Telecom is improving (sxkp) while oil&gas (sxep) and especially health care (sxdp) are still underperforming the Stoxx index.(base line)
Publié par
HEIREBAUDT FREDERIC
à
10:57 AM
0
commentaires
![]()
Libellés : SECTEURS
Today the Brent validates a bullish breakout from a rectangle pattern above an important resistance.
On the daily chart the first target according to fibonacci extension is above 86 and the next one around 94$.

Publié par
HEIREBAUDT FREDERIC
à
9:59 AM
0
commentaires
![]()
Libellés : MATIERES PREMIERES
Here is an update of my trading portfolio.
Publié par
HEIREBAUDT FREDERIC
à
4:31 PM
0
commentaires
![]()
Libellés : SIGNAUX


Publié par
HEIREBAUDT FREDERIC
à
2:43 PM
0
commentaires
![]()
Libellés : TECHNICAL WEEKLY
For those of you who think Asia is going to crash, check out this chart coming from the foundation for the study of cycle.

Publié par
HEIREBAUDT FREDERIC
à
2:10 PM
0
commentaires
![]()
Libellés : INDICES
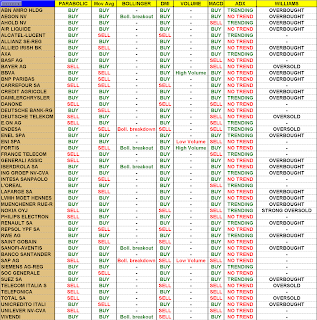
This table below is a summary of different indicators for the members of the DJ Euro Stoxx 50.

Publié par
HEIREBAUDT FREDERIC
à
10:41 AM
0
commentaires
![]()
Libellés : SIGNAUX
Equities
The stock market continued to gain ground and equity indices are now testing new highs but most of them are now overbought.
The powerful breakout from the inverse head and shoulders pattern confirms that investors have embraced risk once again.
In addition, seasonal patterns are turning favorable as we enter the best four month stretch of the year to own stocks.
I have also noticed some change in trends during the recent weeks.
Small caps stocks for instance have not benefited from the recent recovery in
equity markets.(chart 1 Stoxx Small-red line and Stoxx Small vs Stoxx-black line). 


Publié par
HEIREBAUDT FREDERIC
à
11:55 AM
0
commentaires
![]()
Libellés : TECHNICAL WEEKLY
Yesterday the rate validates a bearish signal which cancel the target of 1.44.
A lot of short term sell signals appear (red arrows on chart) so that a retest of the 1.40 is likely.
Publié par
HEIREBAUDT FREDERIC
à
9:37 AM
0
commentaires
![]()
Libellés : DEVISES
The reaction to the Citigroup and UBS news might indicate that investors were expecting a lot worse.
Moreover, the news puts forth more information related to the subprime, suggesting some uncertainty is removed.
As you can see on the 2 charts below, those stocks are trying to rebound (base building) from a very oversold situation.(lots of green arrows)
Strong volumes may also indicate an accumulation phase.
Finally, yesterday was the start of the fourth quarter, a bullish seasonal period for stock.
Publié par
HEIREBAUDT FREDERIC
à
8:57 AM
0
commentaires
![]()
Libellés : SENTIMENT
In terms of US sentiment indicator, one very bullish signal occurred last week. In fact, Commercials (usually right) have closed lots of short futures positions and are now net long in absolute terms .
.
Publié par
HEIREBAUDT FREDERIC
à
3:43 PM
0
commentaires
![]()
Libellés : SENTIMENT

