Technical Weekly 18092006
EQUITIES
Last week positive equity markets actions does not change my technical scenario. September is usually a weak month and we continue to expect another corrective wave to develop into an October 4 year cycle low.
However the last week sharp rebound suggests that investors are still buying the dips but most indices are now overbought and close to resistances.
A break above new highs could prove that momentums are stronger than previously expected and the risk of a blow-off pattern (the peaking of stock prices after a lengthy advance and heavy trading) is rising.
The charts below show the DJ Euro Stoxx50 and the SP500 at critical juncture close to major resistance. 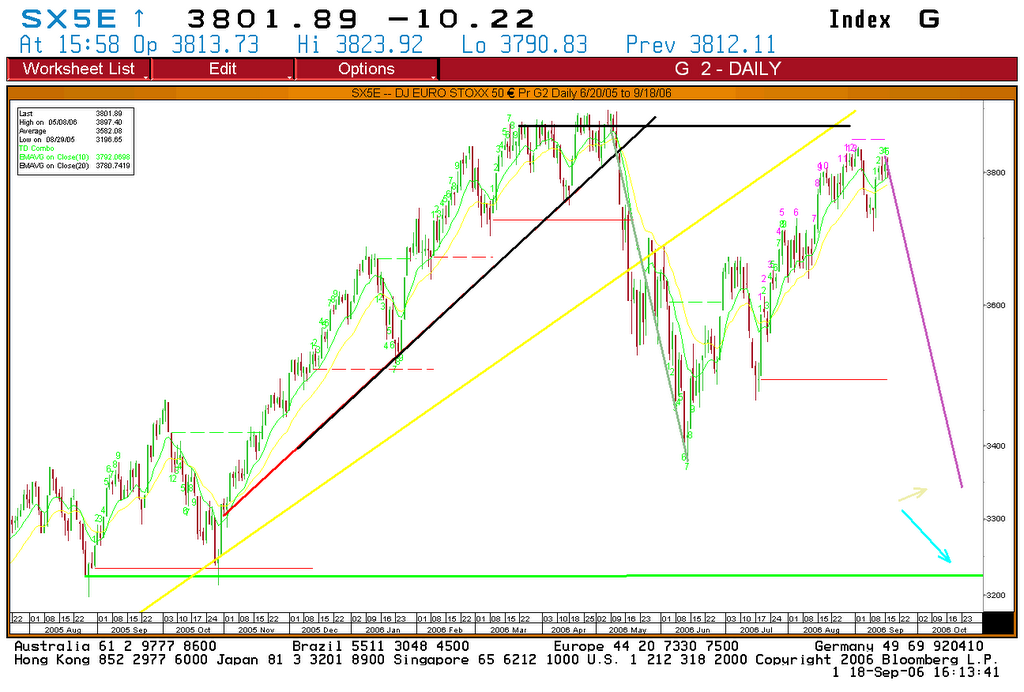

COMMODITIES
Brent
The breakdown below the significant 65$ level and the 200 day moving average triggered the downside acceleration anticipated last week.The downside risk is the lower part of the rising channel on the weekly chart.(see arrow) 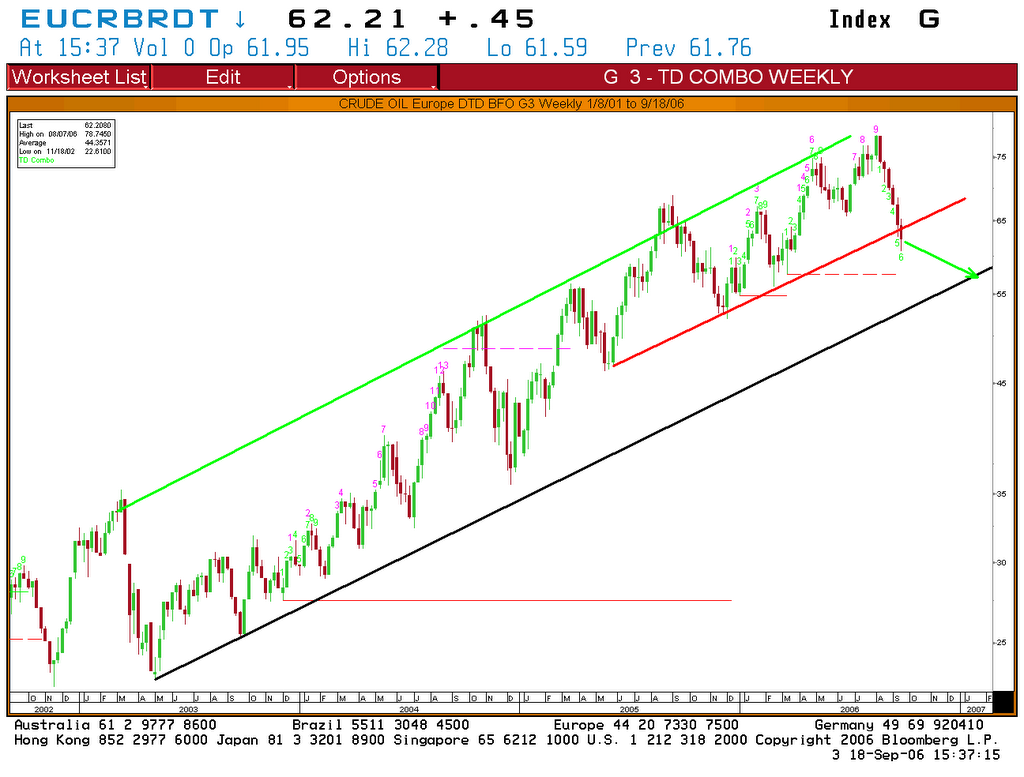
Gold
Last week I said that: the short-term trend is bearish and the low part of the uptrend channel could be testing soon.
Gold trades now below the 200 day moving average and on the weekly chart below we can see that the next support is located in the 550$ zone.
A break below this zone will trigger an important long- term sell signal validating a double top bearish patte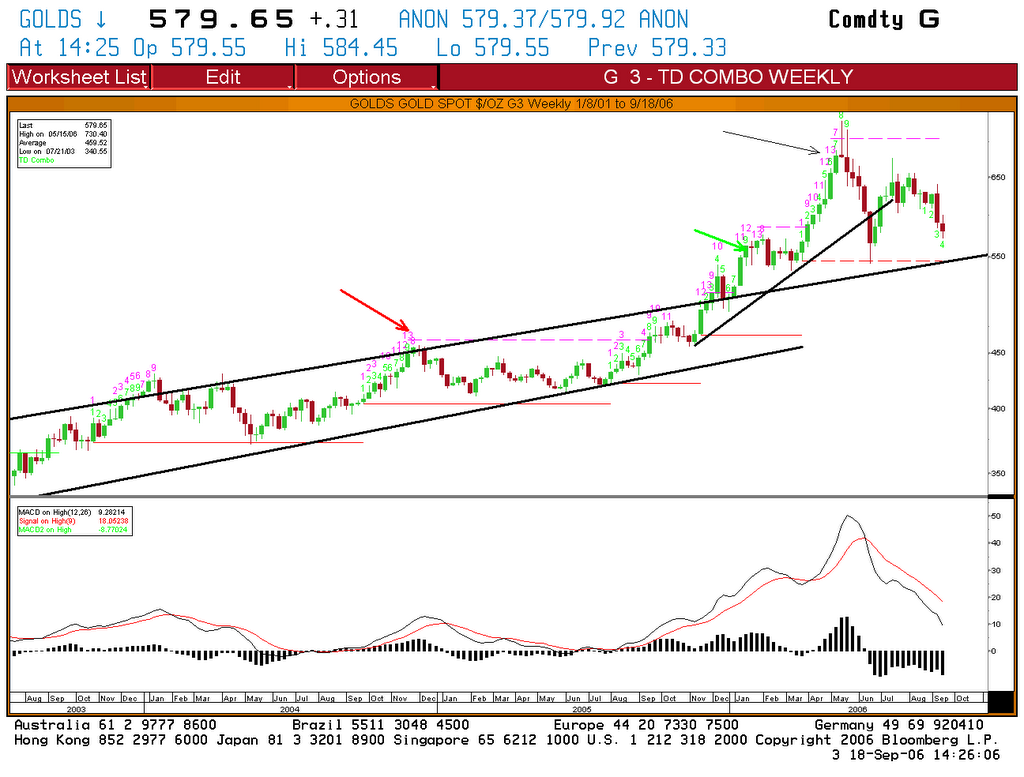 rn.
rn.
GERMAN 10 YEAR YIELD
No change from last week. On the positive side (bearish for bonds) yields have stabilised above the 200-day moving average (in yellow) and are still trading above an important up trend-line. On the negative side, we have a falling 50-day moving average (in green) and short-term resistance around 3.85%.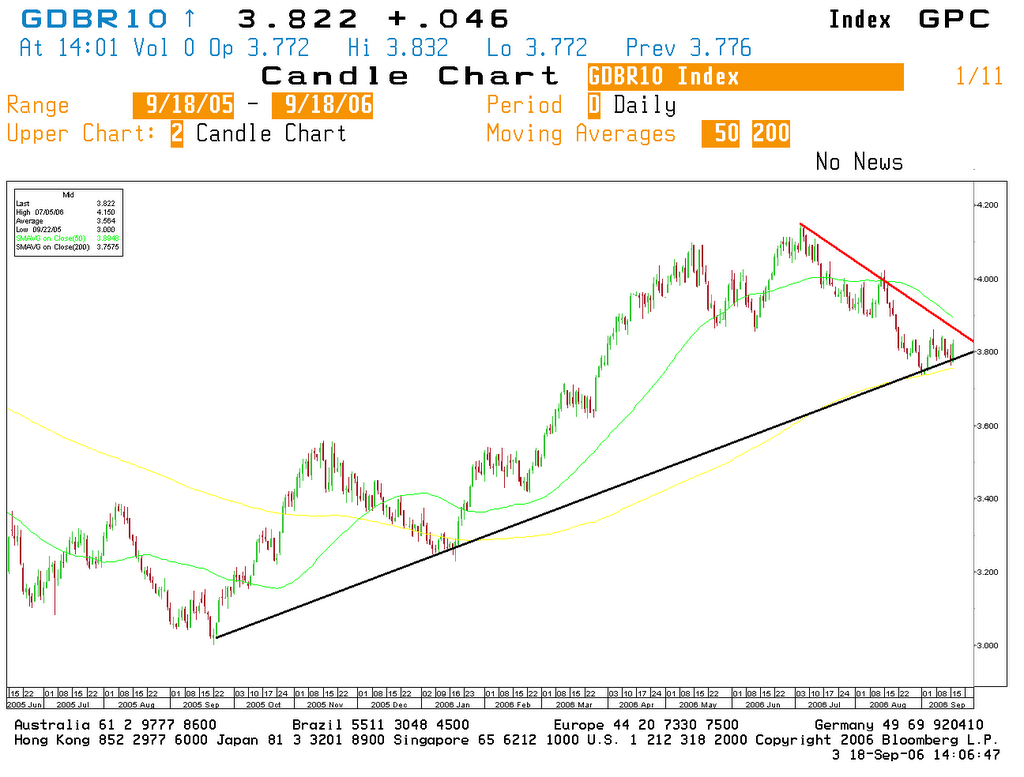
EURO-DOLLAR
The $ is rising against the Euro and the rate recently broke below the 1.27 level.
This event causes a short-term deterioration in the technical outlook.
The downside risk is located at 1.25, which is an important support level.
I also advice to keep an eye on the Dollar index (which is an average of the exchange rates between the $ and 6 major world currencies; see chart below) because a short-term rally is underway and a base could well be forming. 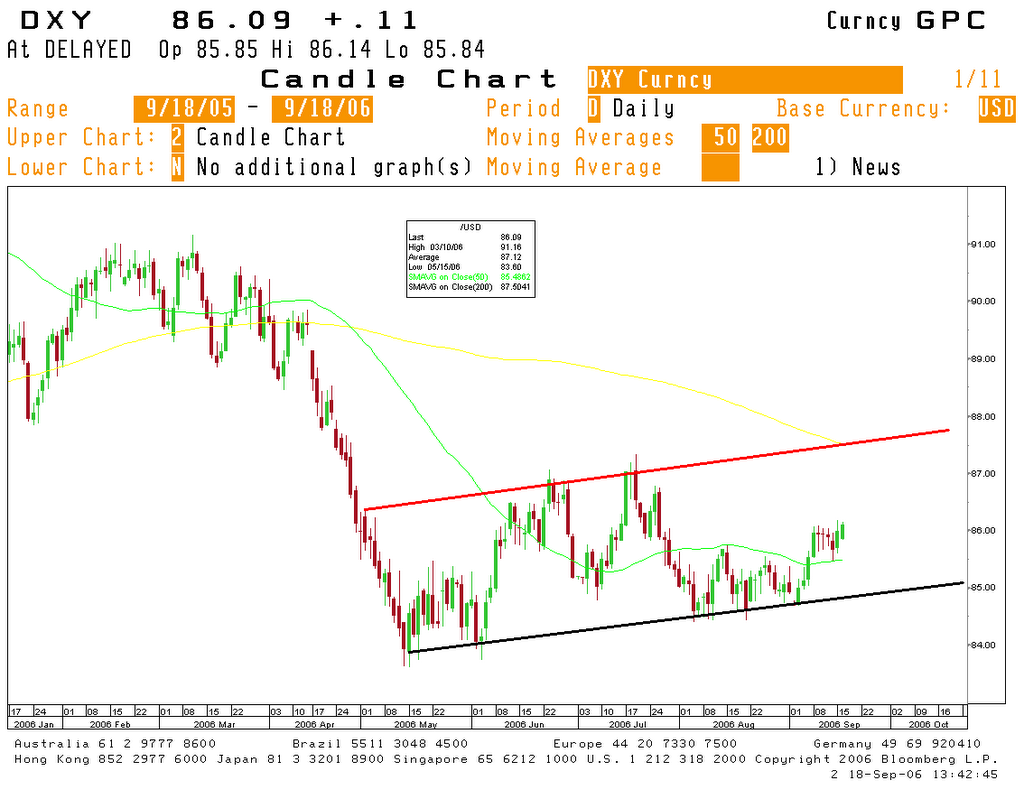


Aucun commentaire:
Enregistrer un commentaire