mercredi, mars 26, 2008
jeudi, mars 20, 2008
$/€
Après avoir validé un signal d’achat fin février sur une sortie haussière un forme de triangle ascendant, le taux de change semble vulnérable à une prise de profit.
Voici pourquoi :
- l’objectif de la figure haussière (1.56) a été largement atteint et dépassé.
- Les indicateurs de tendance sont surachetés sur tous les horizons de temps (mensuel, hebdomadaire et journalier)
- Sur le graphique journalier ci-joint on peut observer un signal de vente récent sur le RSI et sur le TD Combo (nombre 13-flèche sur le graphique)
A ce stade toutefois, rien ne permet d’affirmer qu’un retournement majeur en faveur du $ se produira bientôt, mais il est assez clair qu’une correction vers la droite de tendance haussière au environ des 1.55 est une probabilité importante à cours terme.
Publié par
HEIREBAUDT FREDERIC
à
8:56 AM
0
commentaires
![]()
Libellés : DEVISES
mercredi, mars 19, 2008
Bear trap?
As I said in the previous weekly that: in the short term, most indices are caught in a trading range and are testing January lows.
In the event of renewed panic selling, like in mid-January, I think that the correction could extend below this level.
However, I suspect they are trying to bottoming out in the coming weeks.
And now I think that with the making of the new low on monday ( panic selling) and the nice up-move yesterday, that the monday’s downside acceleration was probably a bear trap.
I also think the market is still caught in a trading range, after all March was already the fifth month down and money could flow from gold and oil (double top on the CRB index) back to stocks and into the dollar.
Publié par
HEIREBAUDT FREDERIC
à
10:44 AM
0
commentaires
![]()
Libellés : INDICES
vendredi, mars 14, 2008
Technical weekly 14032008
Equities


Publié par
HEIREBAUDT FREDERIC
à
2:18 PM
0
commentaires
![]()
Libellés : TECHNICAL WEEKLY
jeudi, mars 13, 2008
Smart&dumb money
The 2 charts below show the trend of the smart money (black line) and the trend of the dumb money (yellow line-small traders) for the SP 500.(traders commitment)
On the first one you can see that the smart money became short in mid 2000.
In the second one you can see that the smart money were selling equities since end September 07 and became short recently.

Publié par
HEIREBAUDT FREDERIC
à
9:07 AM
0
commentaires
![]()
Libellés : SENTIMENT
mercredi, mars 12, 2008
Yesterday, the fed announces a continued liquidy boost.
Just in time! The SP500 rocketed higher, it was a very bullish session and the index was able to rebound on a very important support level.
Do the fed look at charts, I don’t know but this could mark the start of a more sustained rally.
Long term momentum indactors are deeply oversold and sentiment indicators are pessimistic with clear signs of capitulation among retail investors.
Economists are very bearish and most of them think the US economy is already in recession.
This is good news!According to Ned Davis Research, the market bottoms in recessions have been followed by median gains for the SP500 of 15% 3 months later, 23% 6 months later and 34% a year later.
Moreover, since 2000, technical analysts have noticed that a significant trend reversal has always occurred during March: major high in March 2000, low in March 2001 , high in March 2002 , major low in March 2003, high in March 2004 , minor high in March 2005 and minor low in March 2006.
Publié par
HEIREBAUDT FREDERIC
à
9:47 AM
0
commentaires
![]()
Libellés : INDICES
lundi, mars 10, 2008
La bourse ou l'économie?
La plupart des grandes banques se basent sur un scénario macro économique pour anticiper une hausse ou une baisse des marches d’actions.
Pourtant on lit et on entend souvent que la bourse anticipe l’économie.
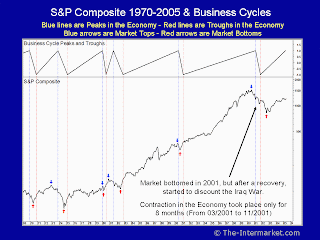
Les deux graphiques ci-dessous sont une façon objective de répondre à cette importante question.
Ils comparent le S&P composite et le cycle économique mesuré par le “National Bureau of Economic Research”(http://www.nber.org) depuis 1900.
Les lignes verticales rougent indiquant les contractions (points bas) et celles en bleues les expansions (points hauts) du cycle économique en cours.
Pour l’indice, les flèches rouges indiquent les creux et les bleues les pics.
On peut clairement remarquer que la bourse anticipe bien l’économie dans la plupart des cas.
Les trois seules exceptions en plus de 100 ans se sont produitent pendant les deux geurres et en 2001.
Les graphiques et les commentaires sur les graphiques proviennent de M.Elio Zammuto.(http://www.the-intermarket.com) 

Publié par
HEIREBAUDT FREDERIC
à
4:21 PM
0
commentaires
![]()
Libellés : SENTIMENT
vendredi, mars 07, 2008
Technical weekly 07032008
Equities
In the medium term, equity indices remain in bearish trends.In the short term, most indices are caught in a trading range and are testing January lows. In the event of renewed panic selling, like in mid-January, I think that the correction could extend below this level.


Brent

Euro
Publié par
HEIREBAUDT FREDERIC
à
4:05 PM
0
commentaires
![]()
Libellés : TECHNICAL WEEKLY
mercredi, mars 05, 2008
Equity market cycle
According to this chart coming from Morgan Stanley, investors psychology (technical analysis) is definitely something to watch in those market conditions.
Publié par
HEIREBAUDT FREDERIC
à
11:38 AM
0
commentaires
![]()
Libellés : SENTIMENT
mardi, mars 04, 2008
A light in the dark?
Today, two of the best contrarian indicators TD Combo and TD sequential are flashing "a low risk buy signal" for the DJ Euro Stoxx 50.
Arrows on the chart indicate buy and sell signals.
Publié par
HEIREBAUDT FREDERIC
à
2:50 PM
0
commentaires
![]()
Libellés : SIGNAUX
lundi, mars 03, 2008
Why using now a technical analysis appraoch
Day by day one of the best research boutique specialized in behavioural and technical analysis were ranked second best research bureau in Europe for 2007.(more infos on DayByDay Independent Research)
This is not surprising to me, here is why.
The chart below of the Dow Jones Industrial suggests that a 17 year period of dorming followed by a 17 year period of intensity appear to exist.
Note that during the 1966 to 1982 last dormant period , volatility was very high.
This was a period when technical analysts outshine fundamentalist analysts because the buy and hold phylosophy breaks down.
Historical cycle suggest that this present dormant period should last until the years 2016-2017.
Warren Buffet doesn’t use technical analysis, however it is intereresting to note that he has long used the 17 year cycle in his investment planning.
Publié par
HEIREBAUDT FREDERIC
à
9:57 AM
0
commentaires
![]()
Libellés : LIENS/ARTICLES
samedi, mars 01, 2008
Semaine du 25 au 29 février 2008
Only in french for now!
Publié par
HEIREBAUDT FREDERIC
à
4:51 PM
0
commentaires
![]()
vendredi, février 29, 2008
Technical Leaders ETF
Please find here http://etfinvestmentoutlook.com/commentary.php?id=10430&s=Technical%20Leaders%20ETF some infos concerning ETF based on technical analysis.
Publié par
HEIREBAUDT FREDERIC
à
4:31 PM
0
commentaires
![]()
Libellés : LIENS/ARTICLES
Zinc-Nyrstar
Après avoir formé une large figure baissière en forme de tête et épaule sur les années 2005 et 2006, le prix du zinc a depuis quelques mois déja atteint l'objectif de cette figure.Depuis lors après une stabilisation sur une importante droite de tendance haussière, le cours semble fortement repartir à la hausse.


Publié par
HEIREBAUDT FREDERIC
à
10:57 AM
0
commentaires
![]()
Libellés : MATIERES PREMIERES
mardi, février 26, 2008
Consumer Confidence
US consumer confidence fell more than forecast in February to the lowest level in five years as the labor market cooled and the economy faltered.The chart below compares the SP500 in yellow and the Consumer Confidence index.
Publié par
HEIREBAUDT FREDERIC
à
4:17 PM
1 commentaires
![]()
Libellés : SENTIMENT
lundi, février 25, 2008
Technical Weekly 25012008
Equities
Most short term indicators are now at oversold levels and most intermediate term indicators we looked are also at oversold readings.
Market internals remain oversold but are improving.
So that the market is oversold enough to rally but for now there is no pattern suggesting a sustained rally.
Taking risks have few chances to be rewarded as long as a valid signal did not appear.A wait and see market is the norm after a very strong decline but, as long as the process of reflection did not come to a end (base forming or distribution pattern?), it is highly preferable to stay on the sidelines.
This week we take a look at emerging markets, the MSCI EM Latin America made a new high (for 2008) last week and is strongly outperforming the Stoxx 600 (black line)
The MSCI EM Asia remains weak and volatile and the MSCI EM Eastern Europe technically ranges between the two others and is outerperforming European stocks.


Publié par
HEIREBAUDT FREDERIC
à
11:54 AM
0
commentaires
![]()
Libellés : TECHNICAL WEEKLY
mercredi, février 20, 2008
Solaria update Part2
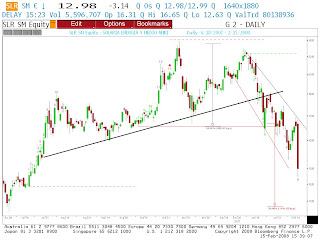
The downside target is close to be reached!
percentage meeting price target :73%(one of the highest)

Publié par
HEIREBAUDT FREDERIC
à
2:57 PM
1 commentaires
![]()
Libellés : SIGNAUX
Fibonacci time projection
Time cycle is often forgotten when analysing markets but it may be more important than price levels in the current environment.
So far, there is still a risk of seeing renewed weakness over the next few weeks, which would probably provide trading opportunities.
It remains difficult to assess the downside risk of such a move and especially whether the January lows will be broken or not.
According to the weekly chart below showing the SP500 and Fibonacci time projections an important low could occur during the end of April. 
Publié par
HEIREBAUDT FREDERIC
à
2:50 PM
0
commentaires
![]()
Libellés : SIGNAUX
lundi, février 18, 2008
Technical weekly 18022008
Equities

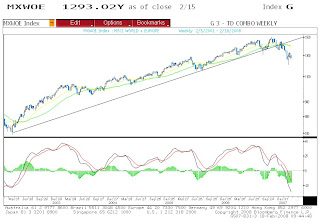
The next chart, a weekly-based chart of the MSCI World Index, continues to confirm that we are in a bear market. There has been a moving average downside crossover (20 weeks below 40 weeks), and the moving averages and Macd continue to move downward.
That could be a reaction to new fears of inflation and that is why we decide to buy inflation linked bonds for our clients.


Publié par
HEIREBAUDT FREDERIC
à
10:44 AM
0
commentaires
![]()
Libellés : TECHNICAL WEEKLY
vendredi, février 15, 2008
Solaria update
Solaria shares drop 20%!
Publié par
HEIREBAUDT FREDERIC
à
3:40 PM
0
commentaires
![]()
Libellés : SIGNAUX


