vendredi, août 31, 2007
mercredi, août 29, 2007
% above moving averages
The Stoxx 600 remains in a bearish correction.The table below shows that only 22% of the members of the index are trading above the 20 day moving averages, 9% above the 50 day MA and 28% above the 200 day MA.
On the contrary bonds are improving ; on the 17 bonds funds I follow 76% of them are trading above the 20 day MA 59% above the 50 day and 65% above the 200 day MA.

Publié par
HEIREBAUDT FREDERIC
à
9:46 AM
0
commentaires
![]()
Libellés : SENTIMENT
Years ending in 7
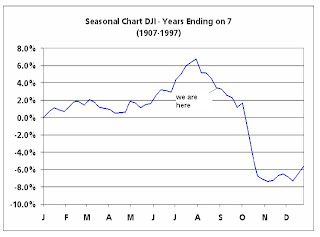
A few months ago I publish an interesting chart about the decennial cycle.
Please find here an update were you can see that years ending in 7 have always be difficult over the last 100 years (in average -3.8% for the Dow Jones) and what is more worrying to me is that the selloff often starts in the second part of the year.

Publié par
HEIREBAUDT FREDERIC
à
8:54 AM
0
commentaires
![]()
Libellés : SENTIMENT
mardi, août 28, 2007
Reprise technique
Le rebond en cours sur le DJ Euro STOXX 50 semble déja se terminer.La moyenne mobile à 200 jours (en jaune) et l'oblique baissière jouent clairement le role de résistance. Mais le point le plus négatif est l'absence de volume depuis la reprise technique.La configuration est identique sur les marchés US.
Publié par
HEIREBAUDT FREDERIC
à
3:26 PM
0
commentaires
![]()
Libellés : INDICES
jeudi, août 16, 2007
US equity strategists
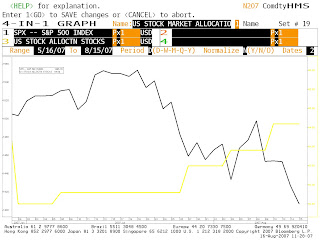
Since the top of the market in June US equity strategists (yellow line) have raised their stock allocations 3 times. Is this a contrarian indicator?
Publié par
HEIREBAUDT FREDERIC
à
11:33 AM
0
commentaires
![]()
Libellés : SENTIMENT
Blood on the street!
DJ EURO STOXX 50 members :the picture is clear, indicators are bearish(red) and a lot of (financial) stocks are breaking down on heavy volume.
Publié par
HEIREBAUDT FREDERIC
à
10:27 AM
0
commentaires
![]()
Libellés : SIGNAUX
Bearish again?
The SP500 and the DJ EURO STOXX 50 have broken their supports.The next 2 charts are thus clearly bearish.


What is worriyng to me is that most long -term indicators (like the MACD) are already bearish.

Publié par
HEIREBAUDT FREDERIC
à
9:22 AM
0
commentaires
![]()
Libellés : INDICES
mardi, août 14, 2007
Technical scoring Stoxx sectors
After the recent correction I take a look at European sectors.
This is a technical scoring from 0 to 10 points based on the positions of the price versus different moving averages.
Publié par
HEIREBAUDT FREDERIC
à
2:46 PM
0
commentaires
![]()
Libellés : SIGNAUX
Technical scenari
The 4 technical scenarii for the equity markets for the coming weeks/months coming from ODDO technical analyst Jean-Christophe Dourret.
"click on the chart to enlarge"
Publié par
HEIREBAUDT FREDERIC
à
10:08 AM
0
commentaires
![]()
Libellés : INDICES
lundi, août 13, 2007
Sentiment indicators
Here are 2 very interesting charts coming from a colleague strategist.
The second one comes from the sentiment index computed by Ned Davis Research.
While it did not generate a formal buy-signal yet, it indicates that investors are too pessimistic towards equity markets.

Publié par
HEIREBAUDT FREDERIC
à
11:23 AM
0
commentaires
![]()
Libellés : SENTIMENT
vendredi, août 10, 2007
Technical weekly 10082007
Equities
What a week! The DJ Euro Stoxx 50 was able to rebound from the 4200 support level and breaks up above the short- term resistance.
Unfortunately this event appears to be a bull trap.(chart 1)
Nevertheless if we look at the daily yearly chart we can see that the odds seems to be bullish.
The reversal at the 200 day line (green) combines with a reversal at the lower uptrendline was technically bullish.(chart 2)

Indicators like Macd and stochastics are also close to give buy signals
As long as the 200 day line and the 4200 level hold up as support on any subsequent pullback, we think the odds favor a bounce in the coming days/weeks.
But as I said last week a break below the 4200 level could produce another wave of selling.
The target of the double top pattern was recently reached (4.3%).
I suspect that the correction is over and that renewed strenght may follow towards 4.5%. in the coming weeks.
But in the coming days a trading range is the most likely scenario.

Last week we said that the TD Combo indicator was flashing a sell signal.
This week, the Brent is trying to stabilize around the 70$ level.
A break below this level implies a bearish target of 61.6$

The euro continues to set higher tops and higher bottoms indicating that the uptrend remains intact. As long as the euro stays above its horizontal support line at 1.365, we will stay bullish with the upper rising trendline as next target/resistance levels. A break back below this level would negate the immediate bullish view suggesting a deeper correction instead with the lower rising support line as next target/support.

Publié par
HEIREBAUDT FREDERIC
à
11:25 AM
0
commentaires
![]()
Libellés : TECHNICAL WEEKLY
mercredi, août 08, 2007
Trading buy in the US?
Trading buy also in the US.
Publié par
HEIREBAUDT FREDERIC
à
4:00 PM
0
commentaires
![]()
Libellés : INDICES
Trading buy?
Today the DJ Euro Stoxx 50 validates a "trading buy" signal.
This is a good risk/reward entry point but on as you can see on the second chart there is no confirmations coming from daily indicators.
Publié par
HEIREBAUDT FREDERIC
à
10:12 AM
0
commentaires
![]()
Libellés : INDICES
lundi, août 06, 2007
vendredi, août 03, 2007
Technical Weekly 03082007
Equities
Still catching my breath from one of the worst weeks in years, I'm going to show you a short -term chart that suggest a bounce may occur in the coming days.
After a very steep decline the price DJ Euro Stoxx 50 was halted by strong support in the 4200 zone.The 200 day moving average in green and the rising lower uptrendline are technically speaking a possible good entry points for “dippers”(buyers).(chart 1)

The model turns negative last week .
Cyclicals sectors are performing very good but financials (banks&insurances) perform very badly.

The target of the double top pattern was recently reached (4.3%).
I suspect that the correction is over and that renewed strenght may follow towards 4.5%.

Still bullish but need a rest after the strong rise.
The 80$ level is a strong resistance and on the weekly chart you can see that the Brent was not able to break above it. Moreover the TD Combo indicator is now flashing a sell signal (arrow).

Long term bullish.Short-term the rate should stay above 1.365 in order to keep the pressure to the upside with the upper rising trendline as next target/resistance levels.

Publié par
HEIREBAUDT FREDERIC
à
11:44 AM
0
commentaires
![]()
Libellés : TECHNICAL WEEKLY


