lundi, octobre 16, 2006

Technical Weekly 16102006

Equities
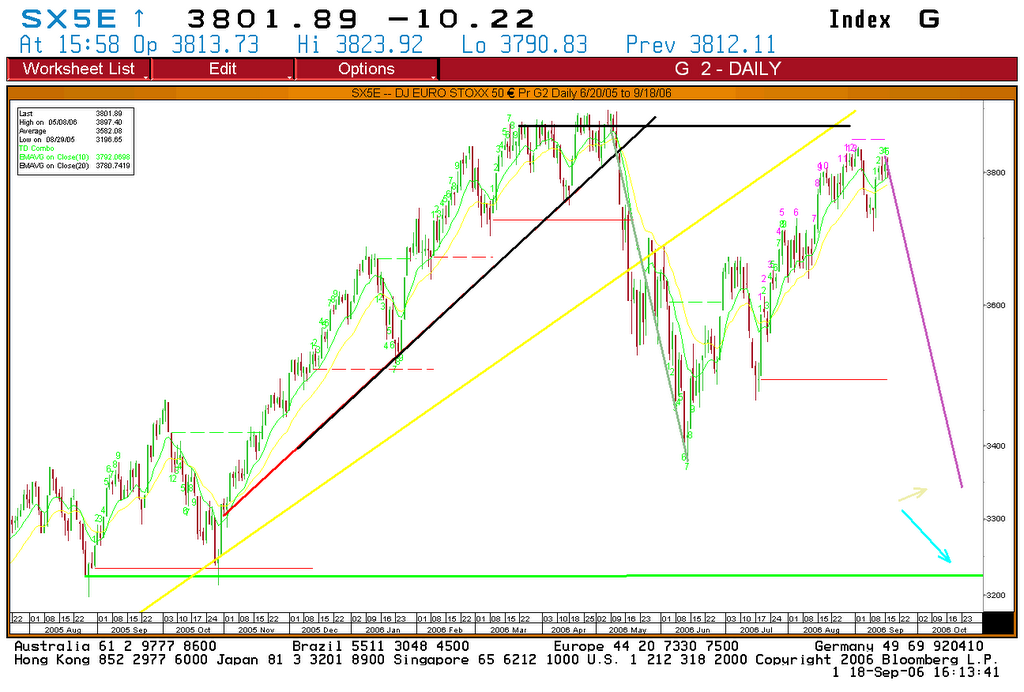
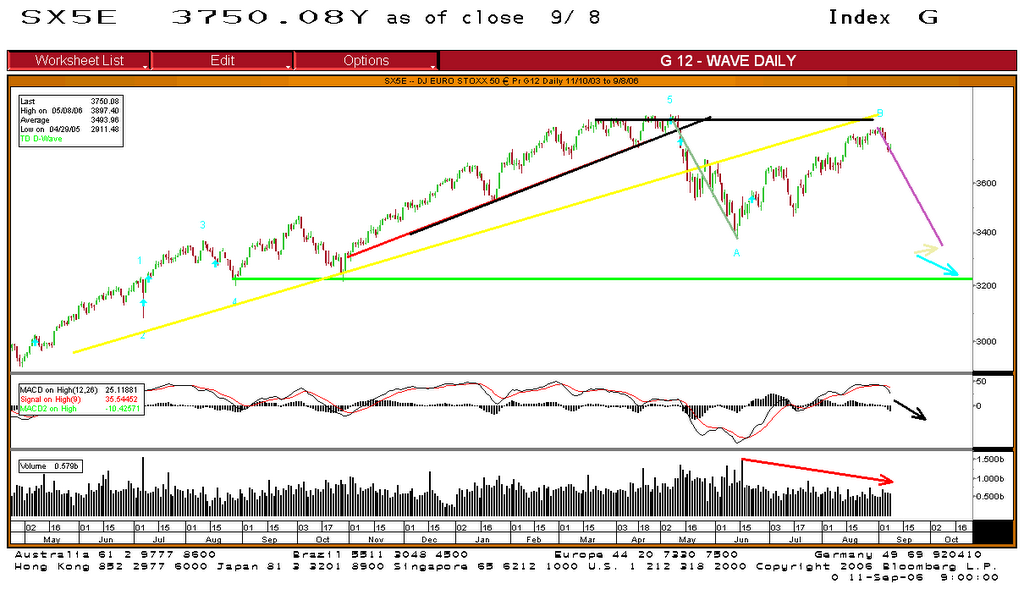
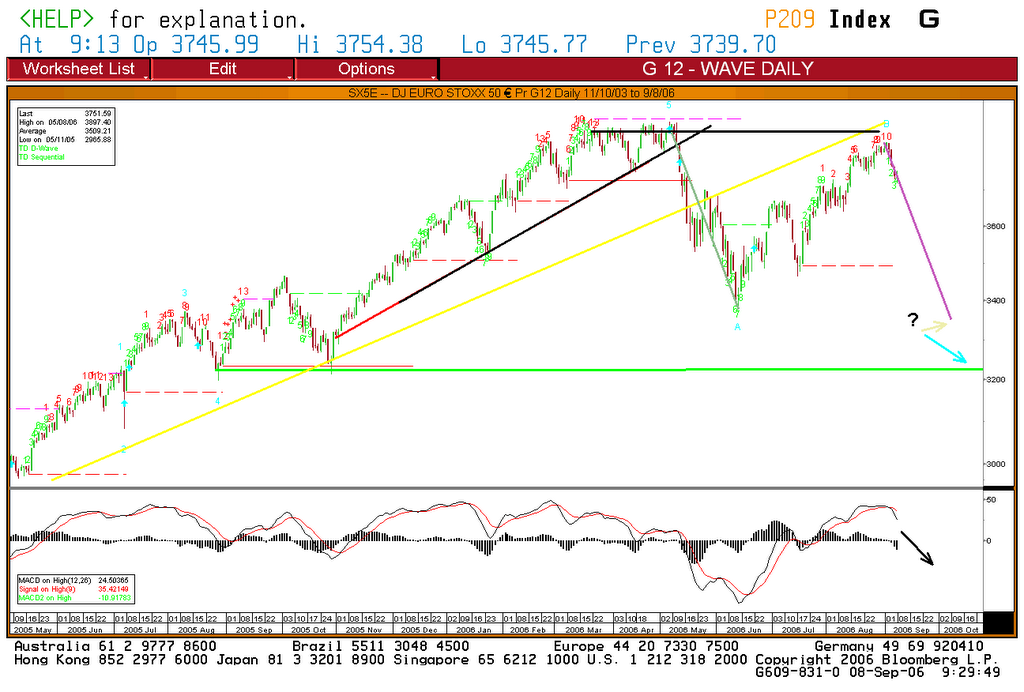
The intermediate term picture remains positive for the equity markets.
In general, there is a lot of complacency regarding the stock market.
I see it in the low levels of volatility, the high level of bullish newsletters but mostly I see it in the media and analysts comments ; no one is calling for a correction, and everyone is mentioning how positive the market is during the last two months of each year.
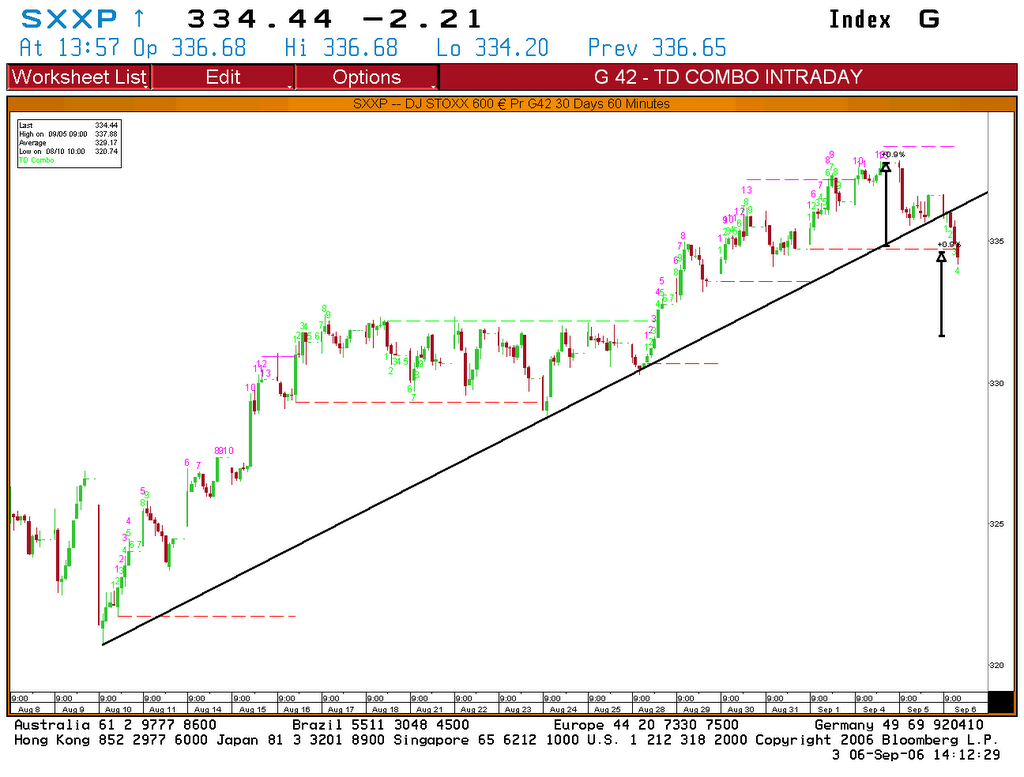
The monthly chart below shows that the trend of the Stoxx 600 is up but overbought.For now, I would not consider taking a bearish position (selling equities) but will enjoy the bullish ride and stay with my long position.
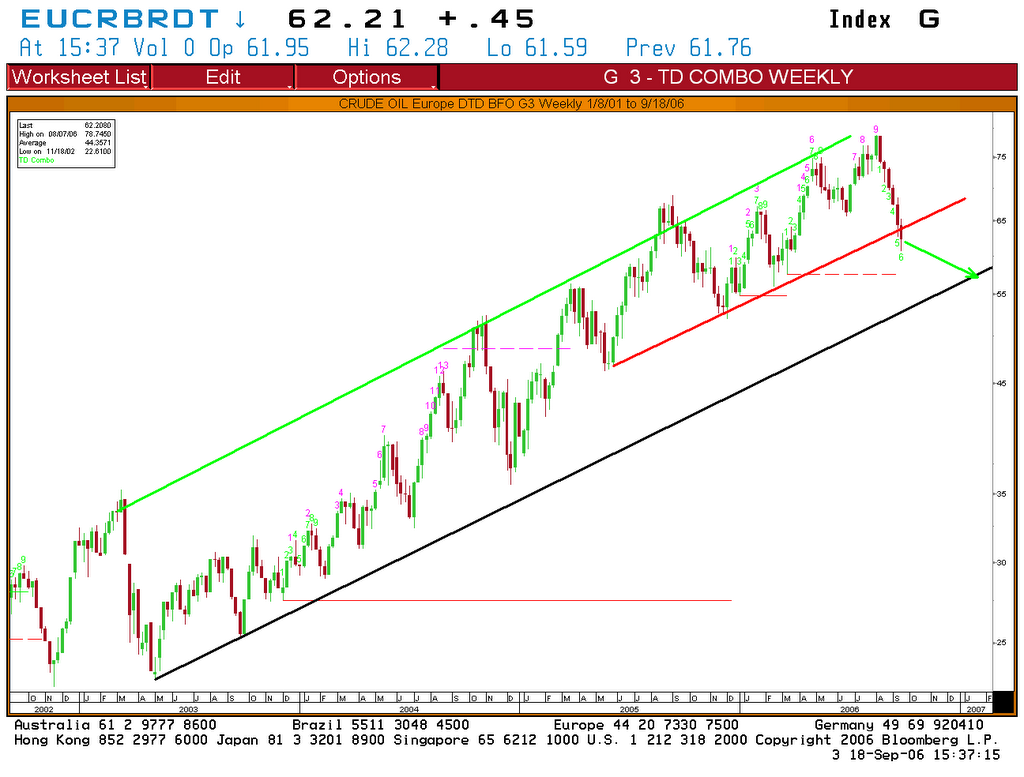
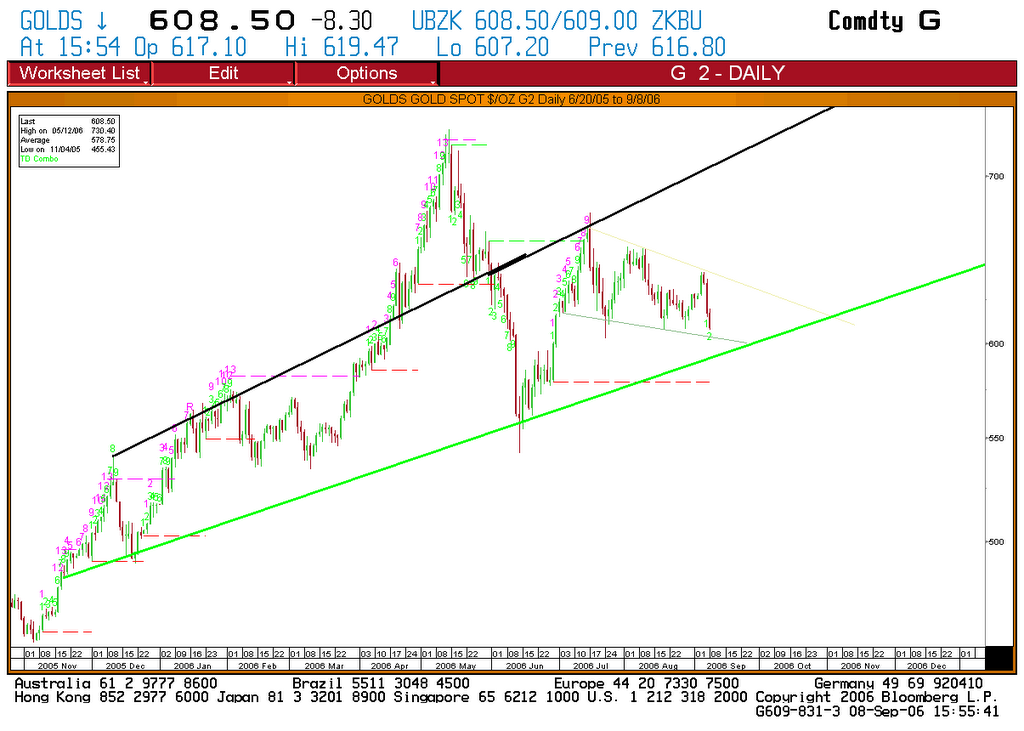


Commodities
This week, I want to focus your attention to the GSCI industrial Metal index (GYX), which is close to an all-time high.
Over the past 15 years moves in the CRB (black line) and GYX (red line) index have traced each other fairly well, at least until the past two months when the CRB has plunged and the GYX has headed higher.
Looking at the constituents of the two index the main difference is that there is no energy or precious metals components in the GYX.This seems to show that prices for commodities - ex energy and precious metals have held up very well and are not pointing to a sharp slowdown in industrial activity.


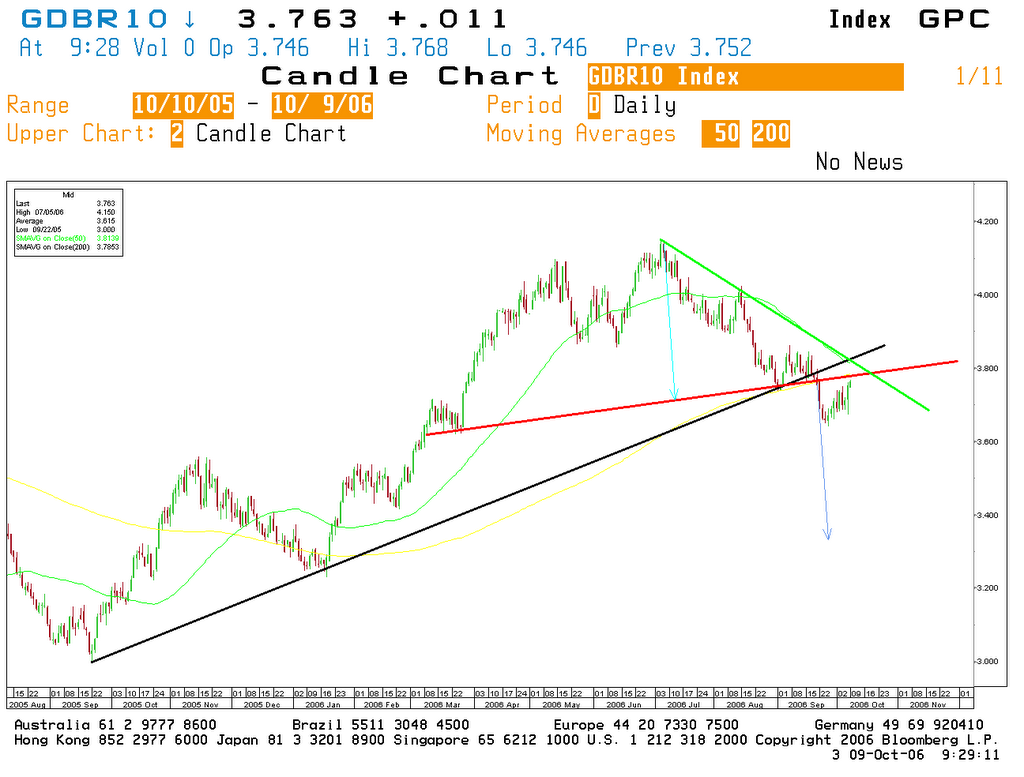
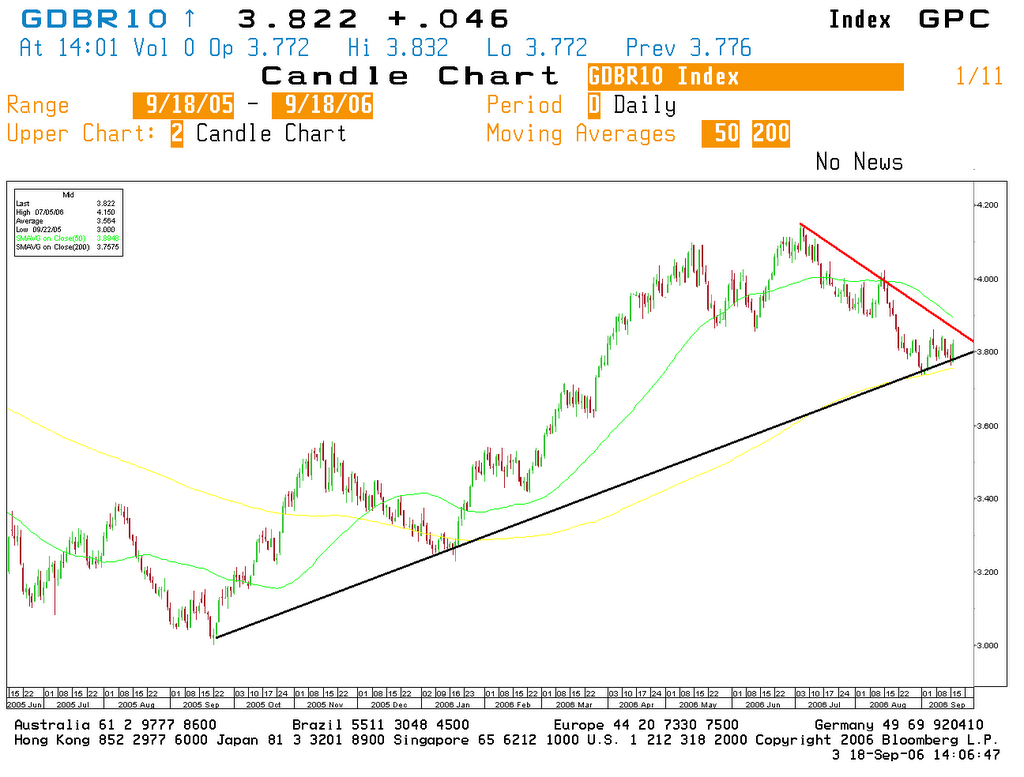
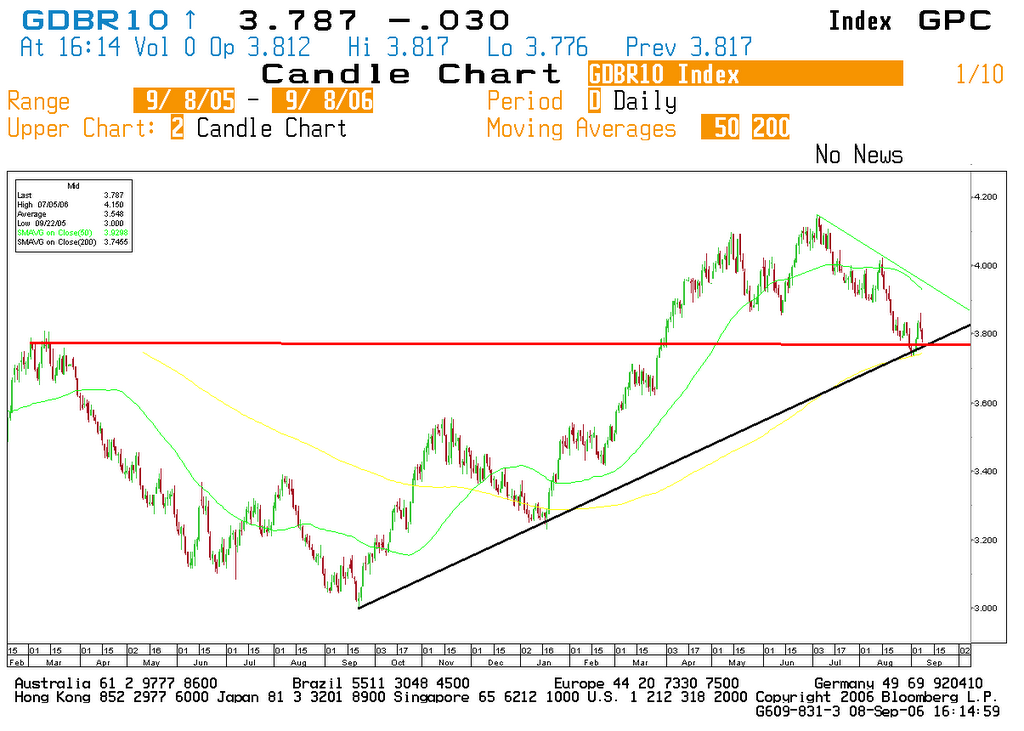
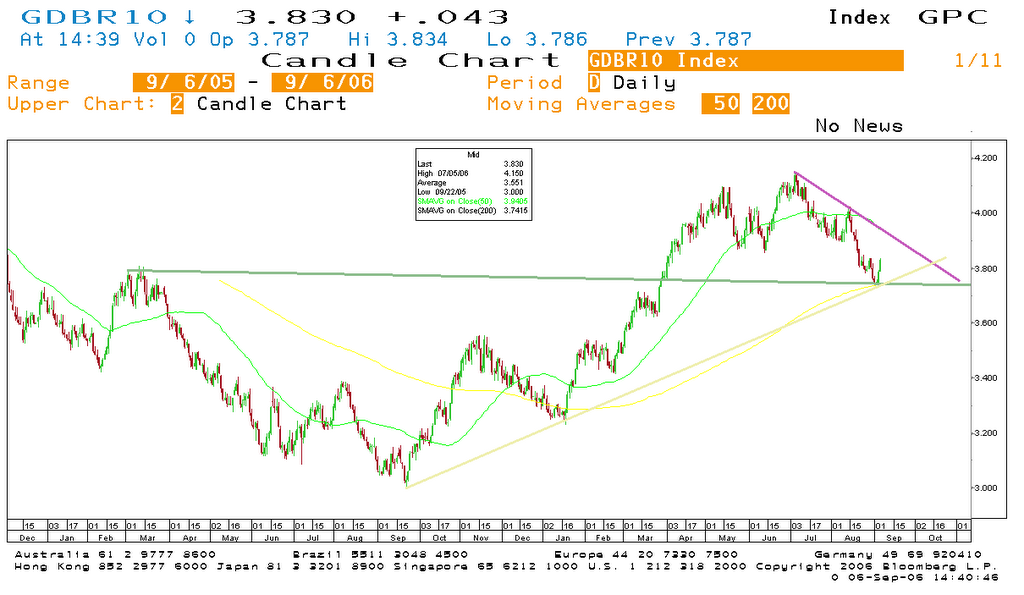
German 10 Year Yield
Yields are trading above the 3.8% level but I'm not sure that this rise will continue.
On the chart below, we can see a lot of resistances at this level.
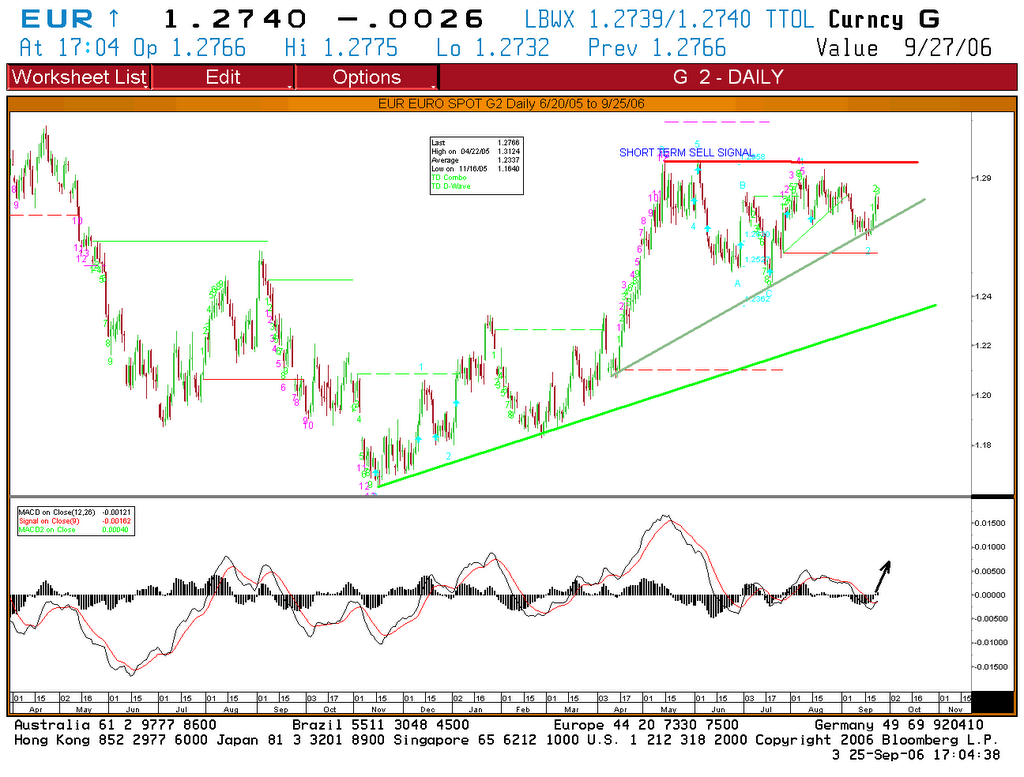
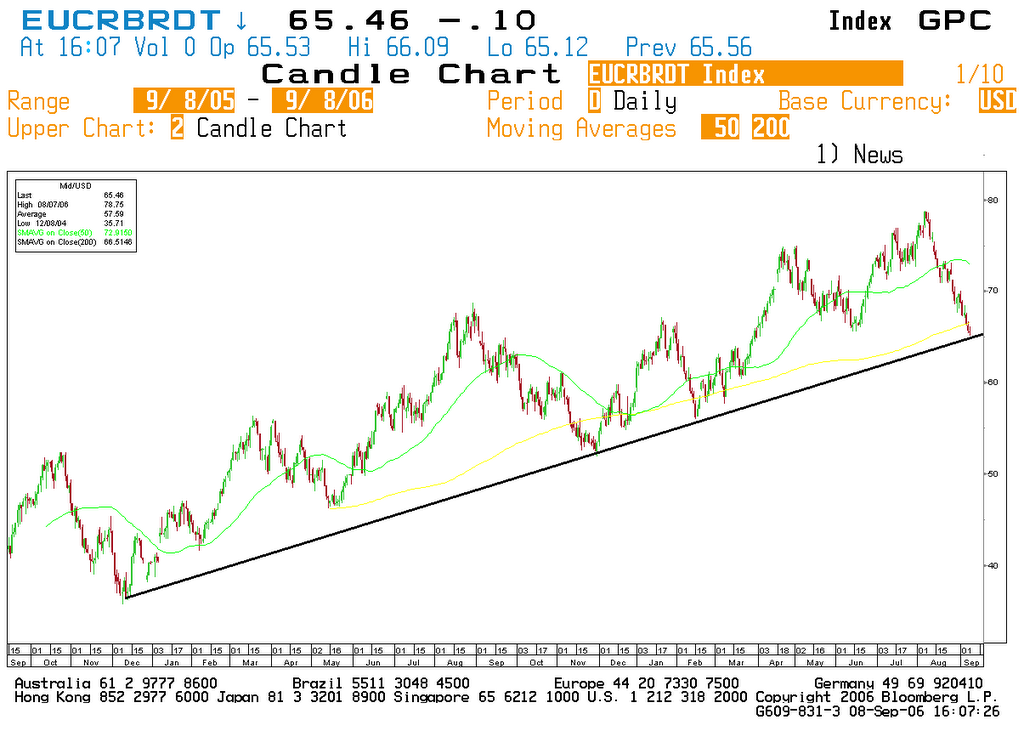
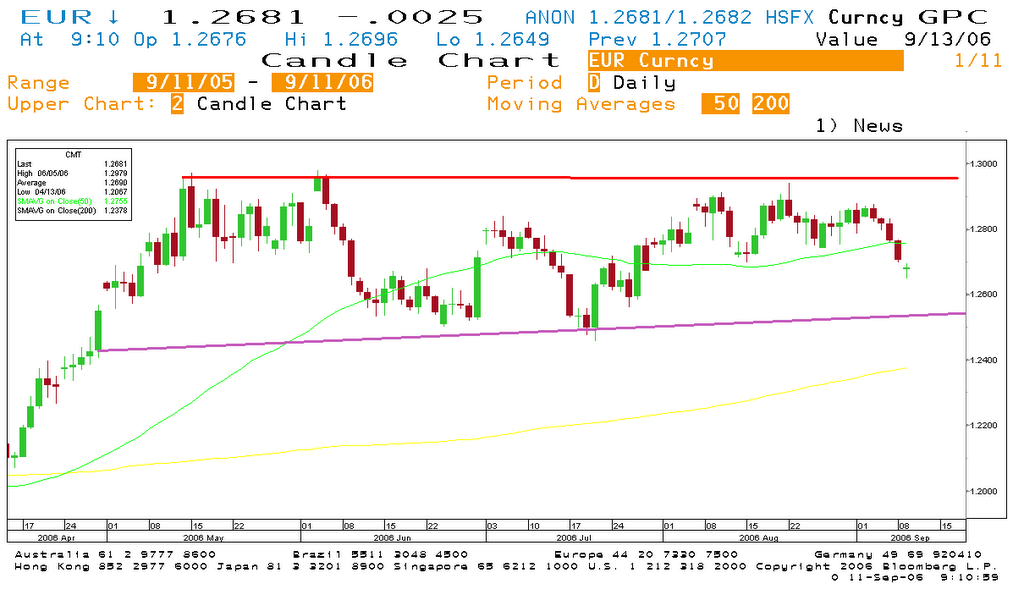


Euro-dollar
The 1.25 level is an important one for the rate.
The weekly Macd indicator is already in bearish mode and volatility remains very low, which means a big move may be coming soon.I will watch closely this level in the coming days because a break below this level may trigger a rally for the $.


mardi, octobre 10, 2006

Le module scoring
Ce module est basé sur les moyennes mobiles ce qui permet de voir la tendance.
20 jours pour le court terme, 50 jours pour le moyen terme, 100 jour pour le long terme et 200 jours pour le très long terme.
Va de zéro à 10 points, la couleur verte étant synonyme de hausse du scoring, le rouge étant synonyme de baisse et le bleu inchangé par rapport au dernier scoring.

Indices larges


Le module de ranking ou de force relative
Pour pouvoir utiliser un classement (ranking) de nos valeurs (actions, indices, sicavs..), nous avons besoin d’un indicateur qui « normalise ».
Cet indicateur est le Rate of Change (ROC). Pour calculer un ROC, on divise simplement le prix de clôture actuel par un prix de clôture passé.
Trois ROC différents sont utilisés : 1, 3 et 6 mois, car un seul ROC pourrait donner trop de faux signaux (trop forte hausse ou baisse à court terme). C’est pourquoi la somme de 3 ROC sur différentes périodes permet de « lisser » le résultat.
Ce résultat final permet donc de comparer n’importe quelles actions (indices) entre elles. A côté de chaque valeur nous avons un chiffre qui nous donne son classement actuel. Ce classement est le plus important, il donne une photo instantanée de la santé technique de l’action.
Cependant, le tout n’est pas de connaître la tendance globale d’une action, il faut également connaître l’évolution de son sens .
C’est pourquoi, une autre colonne nous permet également de savoir combien de places la valeur a gagnées ou perdues pendant une période donnée.
Ceci est très utile pour savoir si la valeur perd ou gagne de la force relative et nous permet rapidement de visualiser les rotations sectorielles.
Le classement et le sens doivent s’analyser en même temps !

secteurs Stoxx


Le module de signaux
Ce module vous donne des signaux techniques d’achat et de vente sur toute une série de valeurs.
Ceci est donc un instrument de timing qui vous permet rapidement de distinguer les valeurs à sélectionner sur base des indicateurs de tendance (trending indicators), sur base des oscillateurs (trading indicators) ou encore sur le comportement de la volatilité (bandes de bollinger) ou des volumes.
Continuation de tendance : tous les indicateurs sont positifs.


Breakout : cassure au-dessus des bandes de bollinger


Valeurs surachetées


Continuation de tendance : tous les indicateurs sont négatifs.


TD Combo&TD Sequential
Ces signaux indiquent quand la tendance risque de se retourner avant que le marché forme un creux ou un pic.
En mensuel à la vente : Iberdrola et San Paolo Emi.

lundi, octobre 09, 2006

Technical Weekly 06102006

EQUITIES
The Dow Jones Industrial is now at all-time highs.
Bulls say this is good, and it is only a matter of time until the other indices follow. Bears have cited a lot of problems, including:
1) None of the other major broad-based indices is even close to an all-time high.
2) The number of NYSE stocks reaching a new 52-week high, the NYSE advance decline line and Dow Jones transport; all of them lagged the S&P500 during the summer.
3) The average Dow stock is actually 32% below its 2000 peak, meaning that the Dow was dragged to these high by a handful of stellar performers.
However, the fact remains that the Dow is at an all-time high and that most other indices have broken out to new five years highs.
These simple facts mean that the upside momentum is strong and therefore the charts of these indices remains bullish.The chart below shows the SP 500 reaching the target of the rising triangle around 1350.The last two candles are hammers which advice caution for the index, at least in the short term.


COMMODITIES
Brent
No change, oil is still extremely oversold on a daily and weekly basis and I think a rebound may be coming soon.The mid –term trend is now down since August but on the weekly chart below, we can see that the 60-58 zone should provide support.


Gold
No change from last week the ounce may continue to weaken towards the support zone around 550$ in the near term.A break below this zone will trigger an important long- term sell signal validating a double top bearish pattern.


GERMAN 10 YEAR YIELD
Breaking down from the strong support at 3.75%, it would need to sustain a close above this level to offset potential for additional downside.
Technically this looks like a big top pattern for yields, meaning that I'm now bullish for bonds.The target of the pattern is located around the 3.4- 3.35%.


EURO-DOLLAR
Two weeks ago I said that: the euro should stay above support at 1.27 in order to keep the immediate outlook bullish and below 1.27 on the other hand, the downward risk would further extend to 1.25.The rate remains range bounded between 1.25 and 1.3 and volatility is very low, which means a big move may be coming soon.

jeudi, octobre 05, 2006

DJ Euro Stoxx 50

Le DJ Euro Stoxx 50 a vaincu la résistance des 3900!
Les projections Fibonacci nous donnent la barre des 4000 points comme premier objectif.
Attention toutefois, un risque d'accélération trop rapide et un optimisme demesuré pourraient déboucher sur un "blow off".

mercredi, octobre 04, 2006

Basic Resources et Telecom

Le secteur des Basic Resources continue de mal prester.
Voici les signaux pour les valeurs faisant parties de l'indice Stoxx.


Par contre le secteur des Telecom me semble techniquement intéressant, avec de nombreuses "cassures haussières" sur les bandes de bollinger.

mardi, octobre 03, 2006

Indices

Le premier graphique nous montre le DJ Euro Stoxx 50 testant toujours l'importante résistance vers les 3900.
L'indicateur stochastique est suracheté et l'indice semble marquer le pas.
L'aide ne viendra probablement pas du marché américain car le SP 500 (graphique 2) approche de l'objectif faisant suite à la sortie d'un triangle ascendant.
En conclusion, le marché est hésitant alors que nous testons des niveaux décisifs sur ces deux indices.
Je pense toujours qu'il vaut mieux adopter une position défensive mais également qu'un dépassement de ces importantes résistances pourrait déboucher sur une forte accélération haussière à court terme.

mardi, septembre 26, 2006

Objectif SP 500=1350

Le SP 500 vient de franchir un nouveau plus haut, l'objectif suivant faisant suite à la sortie haussière du triangle ascendant est de 1350.

Actions et graphique hebdomadaire

Voici quelques actions activent dans différents secteurs qui me semblent intéressantes en se basant sur le graphique hebdomadaire:

TELENET : sortie d'une large base et volume croissant.
Fondamentalement c'est une proie possible.


AHOLD
La confluence de plusieurs moyennes mobiles a provoqué une forte accélération haussière et le dépassement d'une résistance vieille de 4 ans.


STM
Les "technos" connaissent un regan de forme actuellement et après avoir formé un double creux, la valeur est bien partie pour atteindre les 16 EUR.


Quelques autres valeurs toujours intéressantes : PPR, Gaz de France, Alstom, Crédit Suisse, Geberit, Nestle et les télécoms.

lundi, septembre 25, 2006

Technical Weekly 26092006

EQUITIES
Equity indices give not clear directional indications at least on a short- term basis.
The recent weakness still falls within the category of a consolidation and should be traded as such until short-term support is broken.
A break above new highs could prove that momentums are stronger than previously expected and the risk of a blow-off pattern (the peaking of stock prices after a lengthy advance and heavy trading) is rising.
On a mid-term basis I continue to believe that markets are trading in the late stages of their summer recovery and I stick to our cautious stance.
The main topic in the market remains sector rotation and the continued sell-off in commodity sectors.

The chart below compares on a relative basis the falling basic resources (black line) and Oil&Gas sectors (yellow line) with the rising retail (green line) and food&beverage (red line) sectors.


COMMODITIES
Brent
Oil is now extremely oversold on a daily basis and I think it is not the time to be outright bearish on Brent.The mid –term trend is now down since August but on the weekly chart below, we can see that the 60-58 zone should provide support.


Gold
No change from last week the ounce may continue to weaken towards the support zone around 550$ in the near term.

A break below this zone will trigger an important long- term sell signal validating a double top bearish pattern.


GERMAN 10 YEAR YIELD
Breaking down from the strong support at 3.7%, it would need to sustain a close above this level to offset potential for additional downside.
Technically this looks like a big top pattern for yields, meaning that I'm now bullish for bonds.The target of the pattern is located around the 3.35%.


EURO-DOLLAR
The euro should stay above support at 1.27 in order to keep the immediate outlook bullish with 1.30 as next target level.
A break above this level would be very positive because the rate would validate a bullish ascending triangle.

Below 1.27 on the other hand, the downward risk would further extend to 1.25.


jeudi, septembre 21, 2006

Signaux d'achats sur les valeurs de L'Euro Stoxx 50

Pour ceux qui veulent jouer la continuation de la hausse, voici un tableau récapitulant les différentes valeurs qui ont récemment validé un signal d'achat sur la bande de bollinger supérieure.
"cliquez sur le tableau pour l'agrandir"

Fin de cycle ou hausse durable?

Après la forte hausse d'hier la probabilité d'un "blow off" augmente fortement.
Les traders acheterons surement lors de la cassure alors que les investisseurs "long-terme" feront bien d'observer le graphique ci-dessous comparant le MSCI World en 2000 et 2006 (courbe jaune)

mercredi, septembre 20, 2006

Ranking secteurs et performances

Le modèle de ranking recommande les secteurs Retail (sxrp), Food&Bev (sx3p), utilities (sx6p) et Fin.Svcs(sxfp) et la Suisse(tracker xmsmm) comme pays.Depuis le début du mois cette allocation a surperformer le Stoxx 600(sxxp) de 2.36%.
"Cliquez sur l'image pour l'agrandir"


Ces 10 valeurs ont été choisies sur base de l'analyse technique : Abengoa, Agfa Gevaert, PPR, Credit Suisse, Geberit, Nestle, Ahold, STM , Gaz de France et Alstom.
Le but étant de surperformer le Stoxx 600, ce qui a été largement le cas depuis le début du mois puisque la surperformance est de 7.92%!
"cliquez sur l'image pour l'agrandir."

lundi, septembre 18, 2006

Technical Weekly 18092006

EQUITIES
Last week positive equity markets actions does not change my technical scenario. September is usually a weak month and we continue to expect another corrective wave to develop into an October 4 year cycle low.
However the last week sharp rebound suggests that investors are still buying the dips but most indices are now overbought and close to resistances.
A break above new highs could prove that momentums are stronger than previously expected and the risk of a blow-off pattern (the peaking of stock prices after a lengthy advance and heavy trading) is rising.

The charts below show the DJ Euro Stoxx50 and the SP500 at critical juncture close to major resistance.


COMMODITIES
Brent
The breakdown below the significant 65$ level and the 200 day moving average triggered the downside acceleration anticipated last week.The downside risk is the lower part of the rising channel on the weekly chart.(see arrow)


Gold
Last week I said that: the short-term trend is bearish and the low part of the uptrend channel could be testing soon.
Gold trades now below the 200 day moving average and on the weekly chart below we can see that the next support is located in the 550$ zone.
A break below this zone will trigger an important long- term sell signal validating a double top bearish pattern.


GERMAN 10 YEAR YIELD
No change from last week. On the positive side (bearish for bonds) yields have stabilised above the 200-day moving average (in yellow) and are still trading above an important up trend-line. On the negative side, we have a falling 50-day moving average (in green) and short-term resistance around 3.85%.


EURO-DOLLAR
The $ is rising against the Euro and the rate recently broke below the 1.27 level.
This event causes a short-term deterioration in the technical outlook.
The downside risk is located at 1.25, which is an important support level.

I also advice to keep an eye on the Dollar index (which is an average of the exchange rates between the $ and 6 major world currencies; see chart below) because a short-term rally is underway and a base could well be forming.

jeudi, septembre 14, 2006

Nasdaq Composite et SP 500

Bonne nouvelle pour les marchés d'actions à court terme car le Nasdaq composite a récemment confirmer une percée.(graphique 1)
Théoriquement cette figure de retournement en "W" devrait pouvoir amener l'indice près des nouveaux plus hauts d'avril.
Le SP 500 aussi continue sur sa lancée avec un objectif du triangle ascendant vers les 1350 mais avant cela, il lui faudra d'abord franchir l'importante résistance des 1320-1330.(graphique 2).

mardi, septembre 12, 2006

Allocation tactique des actifs

La psychologie influence fortement les cours des actions.
Présentation intéressante sur l'allocation tactique des actifs vu par ING:http://www.ing.be/private/publications.jsp?a=3&t=last&menopt=isopubfin

lundi, septembre 11, 2006

Currency Report

Un rapport intéressant concernant les devises peut être lu ici :http://www.pring.com/pdfs/currency9-10-06.pdf

Ranking actions et performances

Le modèle de ranking recommande les secteurs Retail (sxrp), Food&Bev (sx3p), Cons&Mat(sxop) et Fin.Svcs(sxfp) et la Suisse(tracker xmsmm) comme pays.Depuis le début du mois cette allocation a surperformer le Stoxx 600(sxxp) de 1.74%.
"Cliquez sur l'image pour l'agrandir"

Technical Weekly 11092006

EQUITIES
I think that last Wednesday was the beginning of the second down leg on most indices.
On the daily chart below of the Euro Stoxx 50, one can clearly see that the index has:
1) strongly dropped in May after, according to Elliot waves, an extended fifth wave top.
2) That during the last down days, the fall was fast on the contrary of the last up days in August, this is also the case for volumes, which strongly increased the latter days.
This rise of volumes combined with the fall of prices confirms well that a majority of investors became negative; it acts of a strong indication that the sellers are back and that the second down leg (wave c) has begun.
If we take as market scenario a “flat correction”; this means that wave C as the same intensity and amplitude as wave A, we arrive at an objective close to the low of June.
Pay attention however that the volatility could jump, which implies that investors could not sell under interesting conditions anymore.
Short-term investors could profit from a rebound in the coming days to still sell under good conditions.


COMMODITIES
Brent
Trades now below the 65$ level and below the 200 day moving average.
Technically speaking this level is an important one and a break below it would indicate that a top might already be in place.


Gold
The short-term trend is bearish and the low part of the uptrend channel could be testing soon.


GERMAN 10 YEAR YIELD
The conjunction of the 200 day moving average (in yellow) and a zone of support, as well as the presence of an important ascending trend-line is sufficient to cause a rise of the German 10 year yield. In the coming days, this technical bounce could extend towards 4%.


EURO-DOLLAR
The euro remains trapped in a long-term uptrend.
Odds are still in favour of an upside breakout through the 1.30 resistance, but such a scenario will need to be confirmed.
On a short term basis the trading range still prevails


vendredi, septembre 08, 2006

Correction en cours sur l'Euro Stoxx 50

Ce mercredi a commencé la deuxième phase de baisse sur les principaux indices.
Sur le graphique journalier ci-dessous de l'Euro Stoxx 50, on peut clairement apercevoir que l'indice a :
1) fortement chuté en mai après avoir fait une extension sur la vague 5.
2)que les dernières séances de baisse ont été rapides au contraire des dernières scéances de hausses sur la vague B, idem pour les volumes qui ont fortement augmentés ces derniers jours.

Cette poussée des volumes à la baisse confirme bien qu'une majorité d'investisseurs sont devenus négatifs ; il s'agit d'une indication forte que les vendeurs sont de retour et que la vague C a débuté.
Si nous prenons comme scénario de marché une correction de type "Flat" cad une vague C de même intensité que la vague A nous arrivons à un objectif proche des plus bas de juin.
Attention toutefois que le marché risque de connaître un saut de volatilité qui ne permettra probablement plus de vendre dans des conditions intéressantes et je recommande donc de se couvrir et de profiter d'un léger rebond pour encore alléger dans de bonnes conditions.

mercredi, septembre 06, 2006

Bund-taux 10 ans allemand

La confluence de la moyenne à 200 jours (en jaune), d'une zone de support ainsi que la présence d'une importante droite de tendance ascendante est suffisante pour faire repartir les taux longs à la hausse.(graphique du taux 10 ans allemand).

STOXX 600 intraday

Attention au mois de septembre!
Il semble bien que le Stoxx 600 vient de casser sa tendance haussière sur l'horizon de temps 1 mois (fin du rally d'été).
Sur le graphique, on peut remarquer la cassure de la droite de tendance ascendante qui prévalait depuis le début du mois d'aout et l'incapacité de l'indice de former un nouveau plus haut faisant suite à un signal de vente sur l'indicateur TD Combo (chiffre 13 en mauve).
Il reste cependant à confirmer l'existance d'un nouveau plus bas pour avoir la certitude que le Stoxx 600 entame une tendance baissière.

Matières premières et Chine

Sur le site http://www.fullermoney.com/x/default.html en date du 5 septembre, vous pouvez trouver le résumé d'un article très intéressant publié par Capital Economics expliquant pourquoi la situation de "contango" est un facteur négatif pour les matières premières.
Egalement présent l'avis de JP Morgan sur la Chine.