$
If history is guide, according to this chart based on the 4 year presidential cycle, the US dollar should rise in the coming months.
"click on the chart to enlarge"
If history is guide, according to this chart based on the 4 year presidential cycle, the US dollar should rise in the coming months.
"click on the chart to enlarge"
The €/$ fall below its 200 day moving average (green line) for the first time since March 2006.
As you can see this breakdown was preceeded by a huge negative divergence on the Macd.
The first support zone is 1.488 and the minimun target of this bearish distribution pattern is 1.468.
The US dollar continues its short-term rebound and continues to profit from falling commodity prices.A trading range is expected between 1.6 and 1.54
The rate rebounds strongly at the support zone around 1.54.

Lors de la dernière étude sur l’eurodollar nous avions remarqué que :
-la tendance long terme restait toujours haussière.
-l'importance de la sortie haussière du triangle ascendant, qui permettait d'avaliser le franchissement du seuil psychologique à 1.50 $ pour 1 euro avec comme objectif minimun 1.56.
-Que le taux de change semblait vulnérable à une prise de profit mais que rien ne permettait déja d’affirmer qu’un retournement majeur en faveur du $ se produira bientôt.
Que pouvons-nous observer actuellement :
1/ À moyen terme, la tendance de la parité EUR/USD est toujours orientée à la hausse et un dépassement des nouveaux plus hauts viserait un objectf 1.648.Cet objectif est déterminé par la formation d’un nouveau triangle ascendant mineur.
2/ À court terme, après l'atteinte de la première cible intermédiaire à 1.56 et la légère extension qui a suivi, la devise se trouve désormais en état d'exagération.
Plusieurs éléments le montrent :
-La perte de vitesse du Macd et du RSI dans des territoires tendus, équivalents à ceux atteints lors de la précédente avancée de fin 2007, juste avant le démarrage de la pause.(flêches blanches)

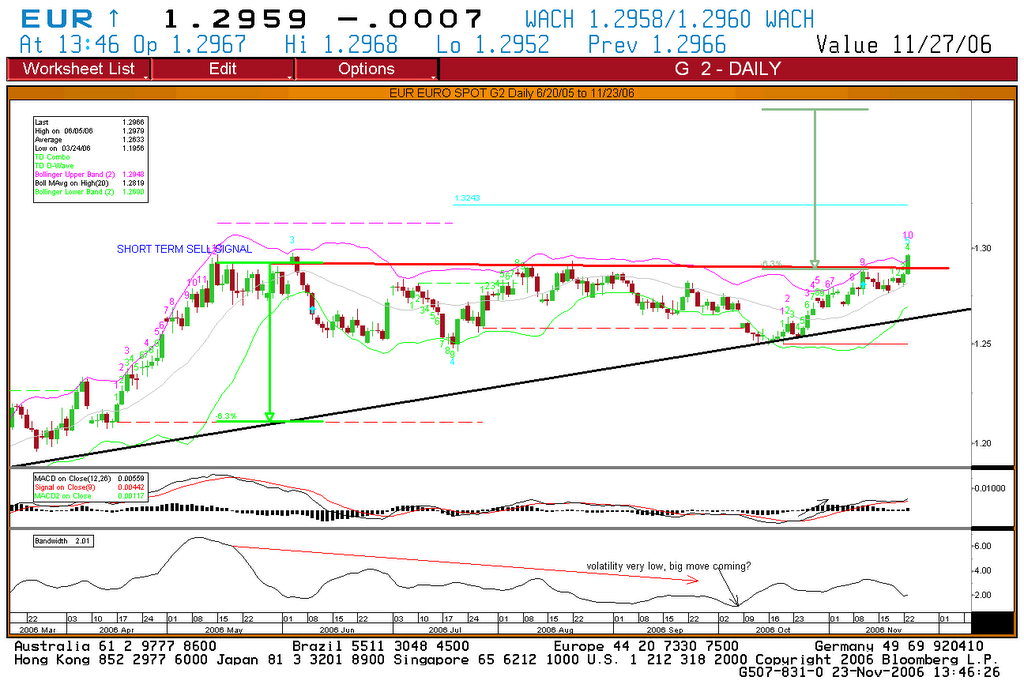
Après avoir validé un signal d’achat fin février sur une sortie haussière un forme de triangle ascendant, le taux de change semble vulnérable à une prise de profit.
Voici pourquoi :
- l’objectif de la figure haussière (1.56) a été largement atteint et dépassé.
- Les indicateurs de tendance sont surachetés sur tous les horizons de temps (mensuel, hebdomadaire et journalier)
- Sur le graphique journalier ci-joint on peut observer un signal de vente récent sur le RSI et sur le TD Combo (nombre 13-flèche sur le graphique)
A ce stade toutefois, rien ne permet d’affirmer qu’un retournement majeur en faveur du $ se produira bientôt, mais il est assez clair qu’une correction vers la droite de tendance haussière au environ des 1.55 est une probabilité importante à cours terme.

Bearish signal for the rate today.A move towards the 1.422 level, which is upper part of the bullish long term channel, seems likely.
On this long term chart of the EUR/USD you can see that the target of the ascending triangle was recently reached.
But was is amazing to me is the nice Fibonacci correlation between the waves.
For instance : W3 =1.618*W2 around 1.492 and W3=0.618*W1 around 1.5.
The 1.4967 top was right between these levels.(thank you Karel !)
Also Wave 2 retraces 38.2% of Wave.
Who says that the market is "a random walk"?

In my opinion the dollar index (DXY) made a bearish descending triangle.
The target of the pattern is around 70 which means 7% downside.
(target of 1.6 on the €/$)
Yesterday the rate validates a bearish signal which cancel the target of 1.44.
A lot of short term sell signals appear (red arrows on chart) so that a retest of the 1.40 is likely.
The euro broke its long term rising resistance line at 1.4000.
Elliotticians often calculate Fibonacci extensions to project the length of Elliott waves.
In this case, the fifth and the first wave patterns are often equal which means a minimun target between 1.43 and 1.44 for the coming weeks.
If we report the width of the long term bullish channel to the breakout, we arrived at the same target
The $ bounce is over as the eur is now trading above the 1.345 resistance level.
Next target towards new highs in the coming weeks.(dot green line)
No need to explain what the famous JPY-carry trade means...
As the graph in attachment shows, odds are turning towards... the end of the carry trade!!!
The JPY is breaking out of its 2006-downtrend (vs EUR), combined with a positive divergence on RSI/MACD. Further upside is likely.
It looks like hedgefunds are changing their strategy towards the JPY-free-lunch-strategy, and are obliged to cover their JPY-loans (buying JPY).
This could hurt the stockmarkets some more in the near future...
Stephan Debruyne. 
On the weekly chart, the Rate is approaching support around 248.
The trend remains bearish but the recent decline was quite steep and a buy signal could occur next week as the TD Combo is flashing a 12.
The last time we had a buy signal (see arrows) the trend reverse strongly in the coming weeks.

La dernière correction sur les marchés (mai-juin) a été précédée d'une forte hausse sur l'Euro-dollar (en noir sur le graph.) qui a progressé de 1.186 à 1.295 en 3 mois de temps.
Il semble bien que l'Euro-dollar soit parvenu à sortir de sa zone de congestion en forme de triangle ascendant.
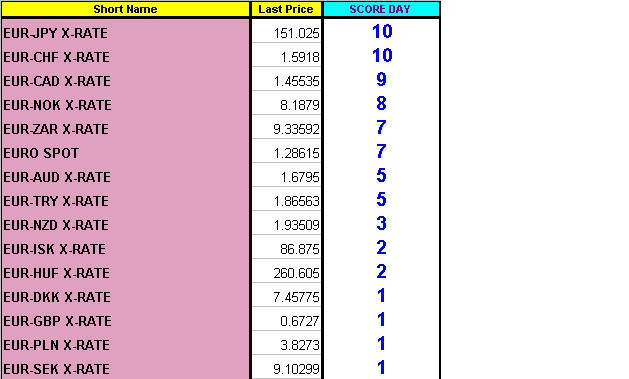
Au niveau des devises la tendance pour l’EUR est très disparate.
Le tableau ci-dessous est un score technique compris entre 0 et 10 points basé sur plusieurs moyennes mobiles.