Affichage des articles dont le libellé est SENTIMENT. Afficher tous les articles

jeudi, mars 13, 2008

Smart&dumb money

The 2 charts below show the trend of the smart money (black line) and the trend of the dumb money (yellow line-small traders) for the SP 500.(traders commitment)
On the first one you can see that the smart money became short in mid 2000.
In the second one you can see that the smart money were selling equities since end September 07 and became short recently.

lundi, mars 10, 2008

La bourse ou l'économie?

La plupart des grandes banques se basent sur un scénario macro économique pour anticiper une hausse ou une baisse des marches d’actions.
Pourtant on lit et on entend souvent que la bourse anticipe l’économie.
Les deux graphiques ci-dessous sont une façon objective de répondre à cette importante question.
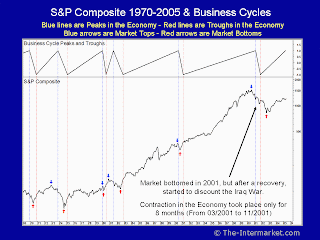
Ils comparent le S&P composite et le cycle économique mesuré par le “National Bureau of Economic Research”(http://www.nber.org) depuis 1900.
Les lignes verticales rougent indiquant les contractions (points bas) et celles en bleues les expansions (points hauts) du cycle économique en cours.
Pour l’indice, les flèches rouges indiquent les creux et les bleues les pics.
On peut clairement remarquer que la bourse anticipe bien l’économie dans la plupart des cas.
Les trois seules exceptions en plus de 100 ans se sont produitent pendant les deux geurres et en 2001.
Les graphiques et les commentaires sur les graphiques proviennent de M.Elio Zammuto.(http://www.the-intermarket.com)

mercredi, mars 05, 2008

Equity market cycle

According to this chart coming from Morgan Stanley, investors psychology (technical analysis) is definitely something to watch in those market conditions.

mardi, février 26, 2008

Consumer Confidence

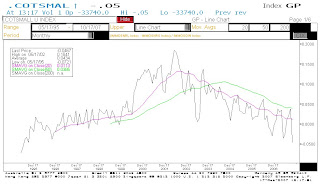
US consumer confidence fell more than forecast in February to the lowest level in five years as the labor market cooled and the economy faltered.The chart below compares the SP500 in yellow and the Consumer Confidence index.

jeudi, janvier 24, 2008

Matrice

La matrice ci-dessous est un outil stratégique (et pas du"market timing") qui me permet de quantifier le trend et le risque return des différentes classes d'actifs.En voici la légende : SXXP=Stoxx 600 Yield = taux 10 ans allemand M=métaux industrielles CRB=matières premières EUR= €/$ AGRI= matières premières agricoles.


jeudi, décembre 13, 2007

Euribor-DJ Euro Stoxx 50

Euribor 1 M rises close to a 7 year high.

The last time the black line (stock market) crosses below the yellow one (money market) it was in September 2000

mardi, décembre 11, 2007

Seasonality

According to this chart, equity markets will remain bullish into December.

lundi, décembre 03, 2007

€/$ Part2

Many thanks to Arthur Hill for this interesting comment concerning sentiment analysis on the greenback.
On the lighter side of analysis.... you can even thrown in a few magazine covers for good measure.
Der Spiegel, Knack and The Economist all featured the falling $ on their covers this week.
The Economist has featured the falling dollar before - so no big deal here.
However, we must be close to a bottom if Der Spiegel and Knack are featuring the falling greenback.
And don't forget about the rapper (Jay-Z) and the Brazilian supermodel, who have suddenly become currency experts by shunning the dollar.

mardi, novembre 27, 2007

US consumer confidence

US consumer confidence decreased today to 87.3.
This is worrying for the US equity markets because this indicator (black line) is strongly correlated with the SP 500 (yellow line).
Also note that the capacity util. Index (green line) is also strongly correlated to the SP 500.

lundi, novembre 26, 2007

Trading buy?

The AAII ratio (red line) decreased to the lowest level since May 2006 (high pessimism).


As the SP 500 rebounds on the support level, we should adopt a more positive posture for equities.

mardi, novembre 20, 2007

Years ending in 7 (part 3)

Remember that chart (decennial pattern-years ending in 7-sending in October),


here is another one coming from the foundation for the study of cycles showing a study they ran in August.


what is striking about this chart was its beautiful predicition of the rally in August and the mini crash that followed , both in terms of points and time.
The good news is that according to the first chart a bottom could be occuring in December.

lundi, novembre 05, 2007

Years ending in 7

A few months ago I publish a chart about the decennial cycle of years ending in 7.

Please find here an update.
So despite good season of the winter months (the traditional end year rally) , November could be a difficult month for equities.

mardi, octobre 23, 2007

Hindenburg omen?

Last week the US market produced a "Hindenburg Omen" (HO), which could be an early warning signal of a bigger correction.
The Hindenburg Omen is a technical analysis signal that attempts to predict a forthcoming stock market crash.More infos :http://en.wikipedia.org/wiki/Hindenburg_Omen

mercredi, octobre 17, 2007

SP 500 Small Traders

The US small traders (dumb money) seem to be expecting some kind of crash again.
In the S&P 500 futures and options, they now have a larger net short position as a percentage of the open interest than at any time since 1995.
May be good news for the end year rally!

mardi, octobre 02, 2007

Subprime

The reaction to the Citigroup and UBS news might indicate that investors were expecting a lot worse.
Moreover, the news puts forth more information related to the subprime, suggesting some uncertainty is removed.
As you can see on the 2 charts below, those stocks are trying to rebound (base building) from a very oversold situation.(lots of green arrows)
Strong volumes may also indicate an accumulation phase.
Finally, yesterday was the start of the fourth quarter, a bullish seasonal period for stock.


lundi, octobre 01, 2007

Commitment of traders report

In terms of US sentiment indicator, one very bullish signal occurred last week. In fact, Commercials (usually right) have closed lots of short futures positions and are now net long in absolute terms.


This is a very bullish signal. Even more so when one considers that small traders (usually wrong) have recently taken the opposite position, i.e. net short.

jeudi, septembre 06, 2007

Bullbear

Interesting study coming from Bespoken (http://bespokeinvest.typepad.com/bespoke/)showing the historical bull and bear markets of the SP 500.

Conclusion : this bull market last for a long time but is relatively weak in terms of performance.

mercredi, août 29, 2007

% above moving averages

The Stoxx 600 remains in a bearish correction.The table below shows that only 22% of the members of the index are trading above the 20 day moving averages, 9% above the 50 day MA and 28% above the 200 day MA.


If the equity markets fail to hold short-term support of the August recovery rally, then the risk of another major downleg is definitely increasing.
On the contrary bonds are improving ; on the 17 bonds funds I follow 76% of them are trading above the 20 day MA 59% above the 50 day and 65% above the 200 day MA.

Years ending in 7

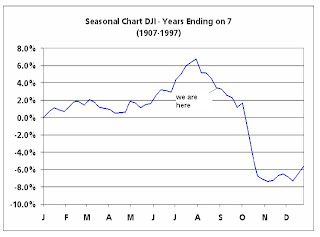
A few months ago I publish an interesting chart about the decennial cycle.
Please find here an update were you can see that years ending in 7 have always be difficult over the last 100 years (in average -3.8% for the Dow Jones) and what is more worrying to me is that the selloff often starts in the second part of the year.

jeudi, août 16, 2007

US equity strategists

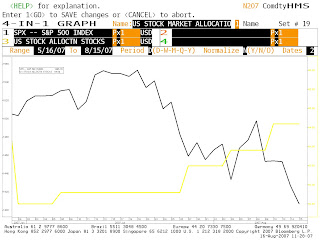
Since the top of the market in June US equity strategists (yellow line) have raised their stock allocations 3 times.Is this a contrarian indicator?