Affichage des articles dont le libellé est SIGNAUX. Afficher tous les articles

mardi, septembre 02, 2008

Buy&sell signals DJ Euro Stoxx50


"click on the table to enlarge"

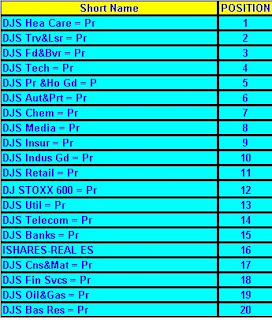
Stoxx sectors rankings

The table below is a ranking system based on a 6 months rate of change (roc) divided by volatility for the Stoxx sectors.


The second one is more sensitive and only composed of different rates of change.

mercredi, août 13, 2008

Stocks - Stuck In A Long-Term Sideways Pattern?


"click on table to enlarge"

mercredi, juillet 23, 2008

Short term bollinger buy&sell signals DJ Euro Stoxx 50

"click on the table to enlarge"

vendredi, juin 27, 2008

Major supports

Completely subjectiv but defitively something to watch for the coming days.


"click on the table to enlarge".

jeudi, juin 05, 2008

Buy&Sell DJ Euro Stoxx 50 and Dow jones Industrials


"click on the tables to enlarge"

mercredi, mars 26, 2008

Buy&sell Dj Euro Stoxx 50 and DJ Industrials


"click on the tables to enlarge"

mardi, mars 04, 2008

A light in the dark?

Today, two of the best contrarian indicators TD Combo and TD sequential are flashing "a low risk buy signal" for the DJ Euro Stoxx 50.
Arrows on the chart indicate buy and sell signals.

mercredi, février 20, 2008

Solaria update Part2

The downside target is close to be reached!

According to Bloomberg, analysts are still bullish with an average target price @ 22.35€.(12 month consensus)
It seems that none of them knows the statistics about double tops.
Here are the numbers :
percentage meeting price target :73%(one of the highest)
break even failure rate : 11%
pullback rate :59%

Fibonacci time projection

Time cycle is often forgotten when analysing markets but it may be more important than price levels in the current environment.
So far, there is still a risk of seeing renewed weakness over the next few weeks, which would probably provide trading opportunities.
It remains difficult to assess the downside risk of such a move and especially whether the January lows will be broken or not.
According to the weekly chart below showing the SP500 and Fibonacci time projections an important low could occur during the end of April.

vendredi, février 15, 2008

Solaria update

Solaria shares drop 20%!

A rumour in the market says that Co books 2008 sales in 2007, and will account them again in 2008.
As a technical analyst, I don't care about rumours but I was worriyng about the "big bearish double top".
Charts don't lie but people (or companies) sometimes do!

jeudi, février 07, 2008

Solaria

New energy shares : hype and reality.
Hoping the price will not reached the target of this (big) double top.

Technical ranking Stoxx sectors based on 3 different rates of change (1,3 and 6 months).
Momentum leads price, the challenge is to identify emerging strength and weakness with accuracy and consistency.
While major markets moves tend to be global in scope, some markets (sectors) are stronger than other, enabling investors to maximize bull markets profits by identifying the leaders and avoiding the laggards.
That’s why the current ranking position is compare to the position n days ago (normally 1 week ago.)


"click on the table to enlarge"


Technical scoring Stoxx sectors based on the 20 day (short), 50 day (mid), 100 day (long) and 200 day (very long) moving averages.From zero to ten points, scoring is green when improving, red when deteriorating and blue when unchanged compared to the previous scoring.


"click on the table to enlarge"


As you can see the sectors rotation forecast is mainly a relative one!

Buy&sell signals DJ Euro Stoxx 50 members


"click on the table to enlarge"

jeudi, décembre 27, 2007

Technical scoring and buy&sell signals

Technical scoring from o to 10 points for the 18 Stoxx sectors+Real Estate.
Number in green when the scoring improving, red when deteriorating and scoring in bleu when unchanged.
The 2 last tables show some technicaly good and bad stocks.


"click on the table to enlarge"'

mardi, décembre 18, 2007

Buy&Sell DJ Euro Stoxx 50


"click on the table to enlarge"

jeudi, novembre 15, 2007

Monthly MACD

The MACD is a usefull (but lagging- it does not try to anticipate major bottoms or tops) trend indicator.
It was designed to signal major turning points.
For instance on the DJ Euro Stoxx 50 since 2000, the monthly indicator gave only 3 signals :
Sell in October 2000
Buy in July 2003
And recently sell in September 2007.

lundi, novembre 12, 2007

Scoring Stoxx sectors

A lot of downgrades and one upgrade (basic resource).

11 sectors (plus real estate) are now bearish and have a scoring (based on different moving averages-from 0 to 10 points) below 5 points.

mardi, octobre 30, 2007

Trading portfolio

Here is an update of my trading portfolio :
10 stocks only big caps or trackers, no cash, no intraday transactions (only close), fees 0.35%.
High turnover and long only.

Today I sold Dassault Syst.because of profit warning and bought Andritz.
Vallourec is also losing momentum but I decide to keep the stock for now.

mardi, octobre 23, 2007

Scoring

Technical scoring for the Stoxx sectors based on different moving averages.

Uge divergences but nothing new : still avoid real estate, media, health care, banks and financials.
Buy telcos, utilities, food&beverage and basic&oil stocks.

vendredi, octobre 12, 2007

Trading portfolio

Here is an update of my trading portfolio.

10 stocks only big caps or trackers, no cash, no intraday transactions (only close), fees 0.35%.
High turnover and long only.(I recently sold AHOLD and NOVO and bought AKER and SYNGENTA).