Technical Weekly 11092006
EQUITIES
I think that last Wednesday was the beginning of the second down leg on most indices.
On the daily chart below of the Euro Stoxx 50, one can clearly see that the index has:
1) strongly dropped in May after, according to Elliot waves, an extended fifth wave top.
2) That during the last down days, the fall was fast on the contrary of the last up days in August, this is also the case for volumes, which strongly increased the latter days.
This rise of volumes combined with the fall of prices confirms well that a majority of investors became negative; it acts of a strong indication that the sellers are back and that the second down leg (wave c) has begun.
If we take as market scenario a “flat correction”; this means that wave C as the same intensity and amplitude as wave A, we arrive at an objective close to the low of June.
Pay attention however that the volatility could jump, which implies that investors could not sell under interesting conditions anymore.
Short-term investors could profit from a rebound in the coming days to still sell under good conditions. 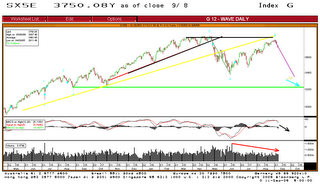
COMMODITIES
Brent
Trades now below the 65$ level and below the 200 day moving average.
Technically speaking this level is an important one and a break below it would indicate that a top might already be in place.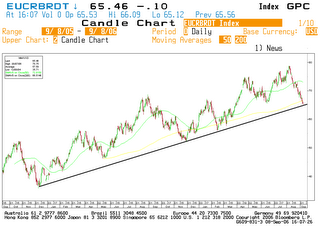
Gold
The short-term trend is bearish and the low part of the uptrend channel could be testing soon.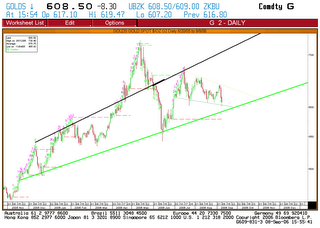
GERMAN 10 YEAR YIELD
The conjunction of the 200 day moving average (in yellow) and a zone of support, as well as the presence of an important ascending trend-line is sufficient to cause a rise of the German 10 year yield. In the coming days, this technical bounce could extend towards 4%.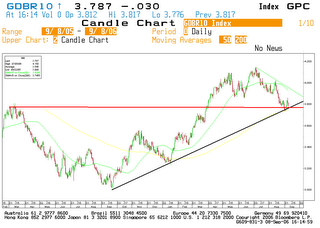
EURO-DOLLAR
The euro remains trapped in a long-term uptrend.
Odds are still in favour of an upside breakout through the 1.30 resistance, but such a scenario will need to be confirmed.
On a short term basis the trading range still prevails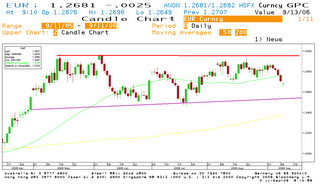


Aucun commentaire:
Enregistrer un commentaire