jeudi, avril 27, 2006

TAUX 10 ANS US

Le graphique long terme mensuel du taux 10 ans US dévoile un profond changement de tendance.
En effet, la barre des 5% ayant été récemment franchie, le trend baissier séculaire qui prévalait depuis 1994 est maintenant terminé.
Techniquement parlant un taux de 7% dans les prochaines années semble tout à fait réaliste.

Euro-dollar

La validation de la sortie d'un triangle ascendant de creux sur l'Euro-dollar nous donne statisquement 89% de chance d'arriver au target (min 1.30) dans les prochaines semaines.

lundi, avril 24, 2006

Technical Weekly 24042006

EQUITIES
European and US markets managed to recover and were upgraded to short-term bullish.
As you can see on the chart of the Euro Stoxx 50 below, the daily Macd indicator is now bullish.(lower panel)

The long-term bull trend is intact but another upside acceleration is likely to precede another correction as the weekly indicator is looking toppish.(mid panel)


COMMODITIES

Brent
Crude Oil remains in a clear uptrend and surges to the 75$ level last week.
As long as the 67 level holds, the uptrend remains intact.

Technically speaking my target remains in the 84-85$ area in the coming weeks.


Gold
Gold has exceeded my target of 630$ and is now overbought.
This current upside acceleration is not sustainable in the short term.
Further short-term correction in Gold is thus expected in the coming days.Nonetheless, the favourable global growth outlook and liquidity conditions do not herald a major reversal.


GERMAN 10 YEAR YIELD
Nothing new this week, as the yield trades close the 4% psychological resistance.

Short-term pullbacks are probable but the next major resistance, which is also the technical upside target remains 4.5%.


EURO-DOLLAR
Breaking above the 1.22 level again.
The bullish trend is slower because of many technical corrections punctuate the rise but I continue to favour $ selling and believe that the rate could reach 1.24 in the coming weeks.

mardi, avril 18, 2006

Technical Weekly 18042006

EQUITIES
The Euro Stoxx 50 and the SP 500 are now close to support level.
I believe that global equity markets could be vulnerable in the short run if oil prices and bond yields keep rising.
The chart below shows the Euro Stoxx 50 with 3 momentum indicators.
The first one, the more important, shows that the long-term trend is still rising.However, the second one which is a weekly momentum is close to give a sell signal and the third one (daily) is still bearish which means that if support is broken, the correction is likely to go further probably toward the 3600 level.


COMMODITIES

Brent
Last week the Brent broke through its 2005 peak to reach his highest level ever.
The Brent has also moved through the psychological level of 70$.

I stay with my mid-term target of 84-85$ in the coming weeks.


Gold
Easily exceeded my short- term target of 610$.

The trend remains bullish and the next target around 630$ could be reached soon.


GERMAN 10 YEAR YIELD
Is now close to the 4% psychological resistance.
I suggested last week that the next upside target was 4.5%.
While I remain convinced that bond yields have embarked on a new uptrend, there is still another technical hurdle that they have to overcome to prove that the long-term downtrend in long-term rates has finally ended.
The monthly chart below shows the downtrend in yields from the 1990 peak. Needless to say, a move above that resistance line around 4.3% would be the final sign that the era of long long-term rates has finally ended.


EURO-DOLLAR
Breaking above the 1.22 level again.

I continue to favour $ selling and believe that the rate could reach 1.24 in the coming weeks.

lundi, avril 10, 2006

PETROLIERES

Après avoir longtemps sous-performé (depuis aout 2005),

les valeurs pétrolières sont proches d'une cassure à la hausse.

La courbe en rouge est le graphique en absolu du Stoxx Oil&Gas

et la courbe en noir le graphique en relatif par rapport au

Stoxx600.

Technical Weekly 10042006

EQUITIES
The stock market did well in the first quarter.
As welcome as the gains were, the Euro Stoxx 50 continues to trade sideways.

The SP 500 however remains strong and should reached the next target between 1330-1350.(see chart below)


COMMODITIES

Brent
Brent is challenging resistance of a major triangle formation around 68$.

A breakout above this level would be very bullish with a high probability to reach the 84-85$ level in the coming weeks.


Gold
Gold and metals continued to move their way higher.
Last week, gold futures contract breached the $600 level for the first time in 25 years.
The chart below shows gold breaking out a symmetrical triangle above the 560$ level.
Next target would be minimum 610$.


GERMAN 10 YEAR YIELD
Broke through a major long term resistance last week.
The next resistance is the psychological one at 4% but the mid-term target in the coming months is now around 4.5%.


EURO-DOLLAR
The breakout above the 1.22 level has been followed by a significant pullback.Nevertheless we still believe that the rate could reach 1.24 in the coming weeks.

lundi, avril 03, 2006

Taux10 ans allemands

Le taux 10 ans vient de valider la cassure d'une importante résistance passant nettement au-desssus du niveau des 3.8%.
Ceci ouvre une perspective haussière importante à moyen terme vers les plus hauts de l'année 2004 à savoir vers 4.5%.

lundi, mars 27, 2006

Technical Weekly 27032006

EQUITIES
In Europe, the long-term trend is rising for 91% of the stocks (Stoxx 600), the medium-term trend is rising for 84% and the short-term trend is bullish for 77%.
As you can see the overall trend remains strong.
Most stocks are still advancing.(45.83%) but note also that 205 stocks (34.17%) are already caught in a short term correction.
So, I can’t exclude the possibility of short- term pullbacks but I don’t expect a major bearish reversal.
In the US, the market is trend-less but as long as the SP 500 holds above 1295, the bulls are still in charge.


COMMODITIES

BrentThe short-term trend remains neutral and I'm waiting for clearer indications.


Gold
Gold rebounds on the support at 540$ and a break above the symmetrical triangle pattern would be very bullish.


GERMAN 10 YEAR YIELD
As I said in the last publication, the short- term trend is improving for bonds and a pullback to the 3.45% level seems now likely.However the medium and long -term trend are bearish
.


EURO-DOLLAR
The breakout above the 1.2 level has been followed by a significant pullback.Nevertheless I still believe that the rate could reach 1.24 in the coming weeks.


lundi, mars 20, 2006

Technical Weekly 20032006

EQUITIES
How long and how far can the bonds decline, and how far can
interest rates rise until the rise becomes potentially bearish for
the stock markets?
The economic numbers continue to improve and the growth estimates are raised for most economic regions but sooner or later the rise in rates will become a drag. Stock markets have continue to benefit from the growth expectations, disregarding the interest rate rise.
But for how long?
For now if we look at the Stoxx 600 (graph 1) for instance the long term trend is still rising for 91% of the stocks , the medium trend is rising for 87% and the short term trend for 80%.
This means that the overall trend is so strong for equities that we should not expect a major bearish reversal, at least in the coming days.


COMMODITIES

Brent

The short-term trend remains neutral and I'm waiting for clearer indications.


Gold
Gold rebounds on the support at 540$ and is likely to resume the long-term uptrend with a break above the 560$.


GERMAN 10 YEAR YIELD
Bond yields have continued to advance in Europe and are now approaching the 3.70% target.
The short-term trend could improve for bonds in the coming days, but the medium and long-term trends are bearish.


EURO-DOLLAR
Last week, the rate breaks the 1.2 level confirming my bullish scenario.

This open the way for a rise to 1.24.

jeudi, mars 16, 2006

SP 500

Hier , le SP500 est enfin parvenu à passer le niveau des 1300 points.
L’objectif à court terme se situant entre 1340 et 1350 ce qui correspond respectivement à la validation d’un triangle ascendant et d’un rectangle.

vendredi, mars 10, 2006

Technical Weekly 100306

EQUITIES
The short-term trend on equity markets is now bearish but the medium and long term trend are still in uptrend which means that the last week correction do not jeopardize the bullish scenario.
The chart below shows the DJ Euro Stoxx 50 with three momentums indicators and as you can see the last one (short term) is down, but the second (mid term) and the first one (long term) are still rising.

There is a risk of seeing more significant short-term correction toward the ascending trend-line (support in red) but as soon as the support hold I view this move as a normal process with no significant trend change.


COMMODITIES

Brent
No change, the trend of the Brent is still bullish but I'm not sure that the consolidation pattern is over.Brent could continue to trade sideways in the coming days.


Gold
Gold is now close to my target, which is the support around 540$.

However a break below the USD540 support zone could extend the correction much lower towards the low of the uptrend channel. (white line)


GERMAN 10 YEAR YIELD
Bond yields have continued to advance since our last study in Europe and are now approaching the 3.70% target.


EURO-DOLLAR

Nothing-new last week as the rate continues to trade sideways.
Short- term volatility remains low.

I still expected limited downside potential from here and think that the bottoming process is developing slowly.

mercredi, mars 08, 2006

DJ EURO STOXX 50

La confluence du soutien(en vert) et de la moyenne à 50 jours sera un test important pour l'indice.A surveiller de près dans les prochains jours.

Smart Money SP 500

Les "gros joueurs" à savoir les commercials sur le SP 500 sont de plus en plus short.


Par contre les "petits porteurs" viennent de fortement d'augmenter leurs positions longues.

lundi, mars 06, 2006

MACD

Récemment, l’indicateur Macd en journalier à validé plusieurs signaux sur différentes classes d’actifs.
En voici quelques unes.
Signal d’achat : sur les matières premières : CRB index


Sur l’Euro-dollar.


Et sur le taux 10 ans Allemand.


Signal de vente : sur le DJ Euro Stoxx 50.


Et enfin proche d’un signal de vente sur le SP 500.

vendredi, février 24, 2006

Cycliques ou défensives?

La composante future de l’indice IFO en Allemagne vient d’atteindre un nouveau plus haut depuis octobre 1994.
Le graphique ci-dessous nous montre une correlation quasi parfaite entre d’une part l’IFO (Business Expectation) et d’autre part un ratio entre les valeurs cycliques et les valeurs defensives.(Stoxx Basic Resources/Stoxx Food&Beverage)La conclusion : il serait peut-être intéressant de prendre quelques profits sur les valeurs cycliques et de revenir progressivement vers les valeurs defensives.

Technical Weekly 24022006


EQUITIES
Earnings development in Europe remains strong and the Dow Jones Stoxx 600 closed at a 4 ½ year high last week.
New M&A developments are still bullish for the market.
In the short term the uptrend is likely to persist and nothing seems able to stop the index from rising right now.
In the US the SP 500 is close to break above the 1300 level, which is a significant resistance.
However euphoria is dangerous and the continuation of a steep uptrend could end in a buying climax that is likely to be followed by a major correction.
The chart below shows the Nikkey 225 testing the 15400 support zone.A break below this support will put Japan at risk for further underperformance in the coming weeks
.


COMMODITIES

Brent
The Brent trades now above the 200 day moving average, but the upside move last week was not so impressive.
I expect a consolidation at this level. Meanwhile price could test the minor resistance (green line) around 60.3$ in the coming days and if this scenario takes place the target will be a rally towards new highs.


Gold
Gold seems to stabilize around the 550$ level. The short -term correction may not be over and a drop to the 540$ level is still possible.However, the mid-long term outlook remains bullish.


GERMAN 10 YEAR YIELD
The consolidation continues and the bond markets are tracing out the rebound that I was looking for to lead to an upside target around 3.7-3.8% for the German yield in the coming weeks.However in the coming days, a continuation of the current consolidation remains the most likely scenario
.


EURO-DOLLAR
Nothing-new last week as the rate continues to trade sideways.
Short- term volatility remains low.I still expected limited downside potential from here as the rate correct 61.8% from the November to end January bullish move, which is a normal process.

lundi, février 20, 2006

Technical Weekly 17022006

lundi, février 13, 2006

Technical Weekly 13022006

EQUITIES
The overall trend remains bullish especially on European and emerging markets regions.
The Russian RTS index for instance has risen 19.5% year to date, Brazil (17%) and China (17%) are not far away.
In the US, the SP 500 is now close to support and I think that the index may continue to trade sideways in the coming weeks.
Interesting moves last week came from sector rotation as I have seen the “oversold” telecom sector attracting bottom fishers and on the other hand, some profit taking were taken in the oil&gas and basic resources sector.
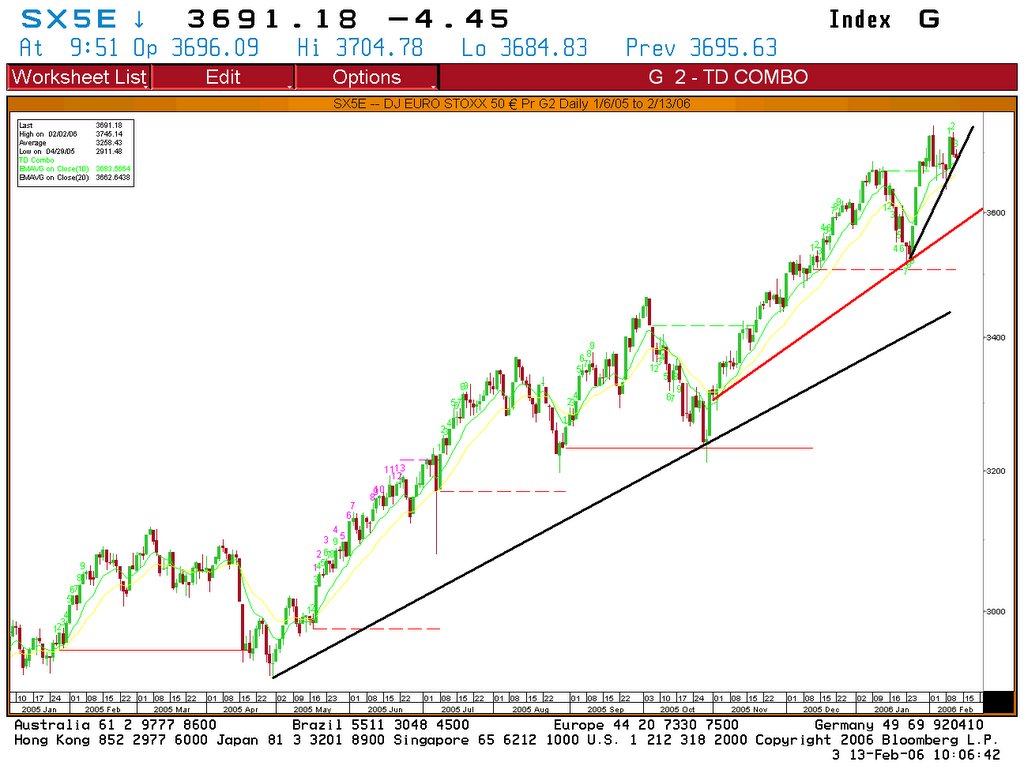
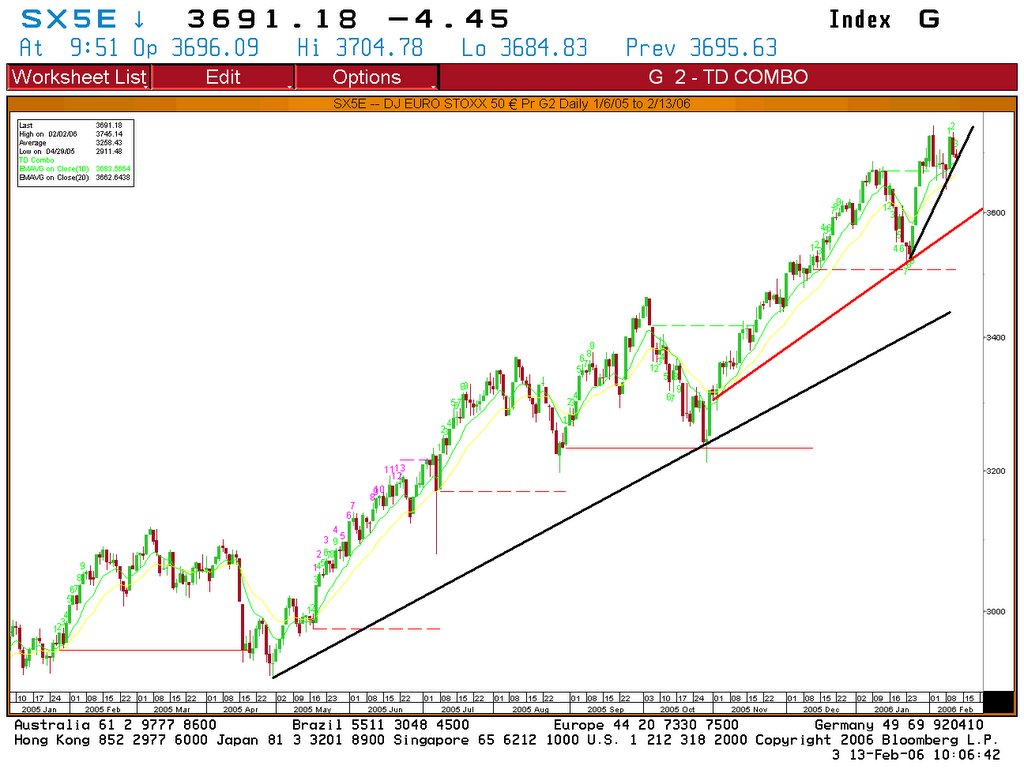
The graphic below of the Euro Stoxx 50, shows that prices are stabilizing around the 3700 level.
For several weeks, the index has been rising sharply and a consolidation is a normal process.A sharp decline seems unlikely because the “buy the dips” mentality still prevails for investors.


COMMODITIES

Brent
Brent has corrected last week and the support line is now in danger.
Oil prices have fallen 9.4% this month.However as you see, the long- term trend is still up for the Brent
.


Gold
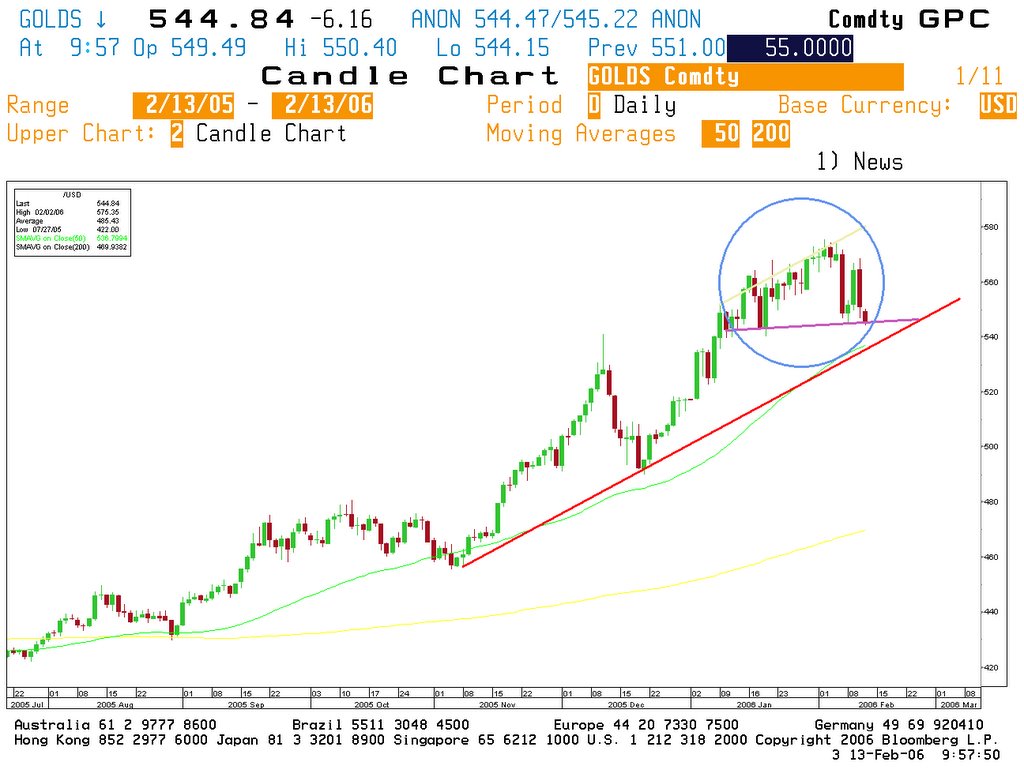
The pullback that I was waiting for is finally happening.
Tuesday’s sell off confirmed this view.
The first support is 545$ but I will watch closely the potentially bearish “right angle broadening pattern” (see circle on the chart below).


GERMAN 10 YEAR YIELD
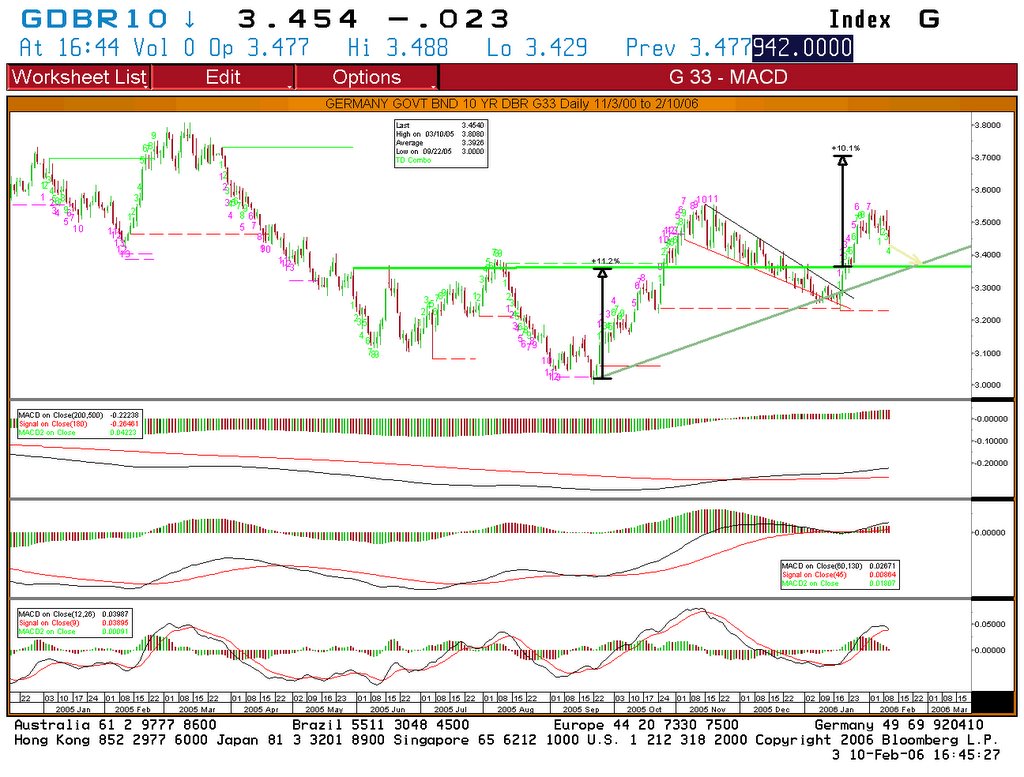
After a strong rise towards 3.5%, yields are consolidating and could retest the 3.37% level soon.(see arrow on chart)

Long term and mid term momentums are up and that is why I believe that a new bearish wave remains possible with a probability of further upside towards 3.7%-3.8%.


EURO-DOLLAR
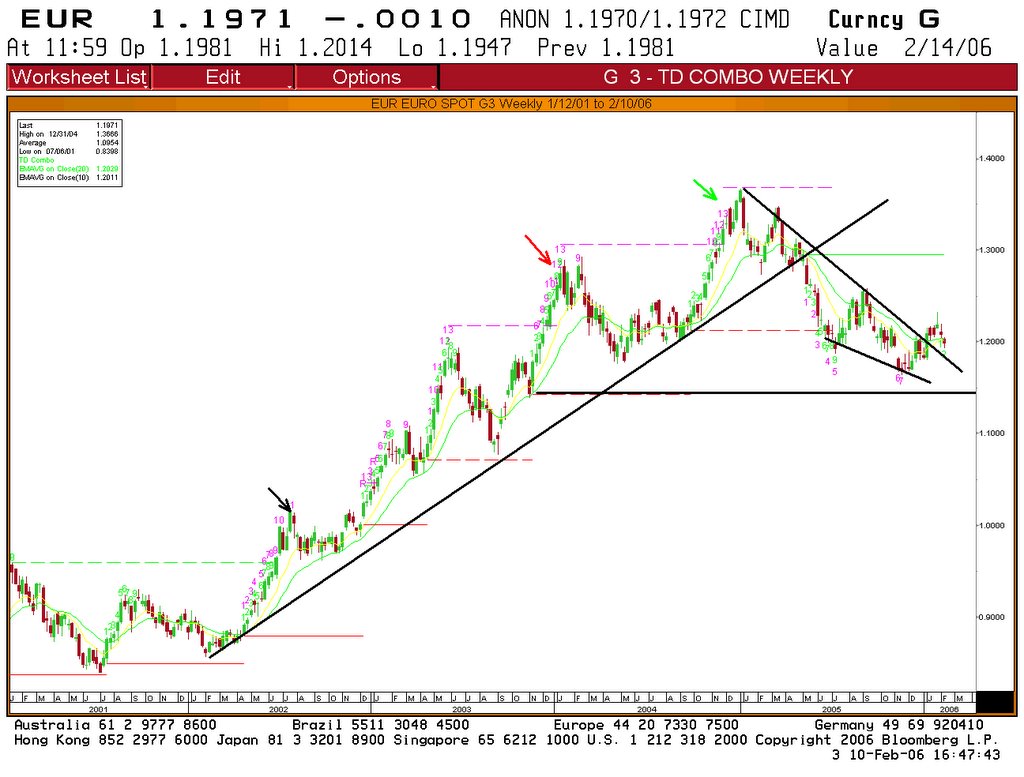
The Euro-dollar is pulling back below the 1.2 level but we expected limited downside potential from here because of the presence of a strong support in this zone.
I view this as a counter trend move and I think that the upside still prevails.

This is a weekly chart showing the breakout from a falling wedge pattern.